


Consumer Economy
- Personal Income (PI) 26.99T +54.9B (+0.20% m/m)
- GDP (GDP) 32.48T +609.5B (+1.91% q/q)
- Durable Goods, New Orders NSA (UMDMNO) 360.4B +3.1B (+9.62% m/m)
- Auto/Light Truck Sales (ALTSALES) 16.6M +460.0K (+2.86% m/m)
- UM Consumer Sentiment (UMCSENT) 55.20 +5.70 (+11.52% m/m)
Personal Income – unadjusted for inflation – trickled up 0.20%, or 2.4% annualized. The little people’s salaries are NOT keeping up with inflation.
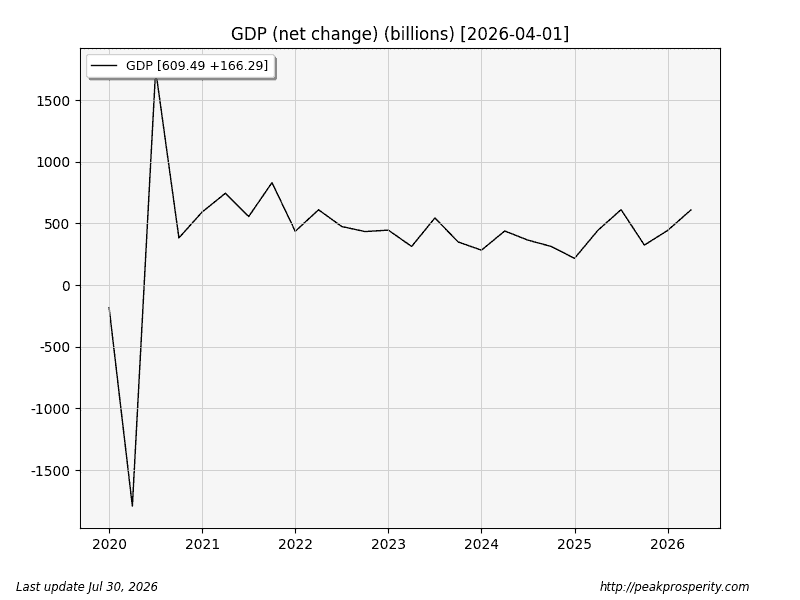
This, while GDP (unadjusted for inflation) rose by 1.91% in Q2, which is 7.64% annualized. That’s doing a bit better. The chart below shows net change q/q for GDP, which is now (at 609B) back to Q3 2025 levels, and the trend does seem to be moving higher. Levels above 0 = expansion.
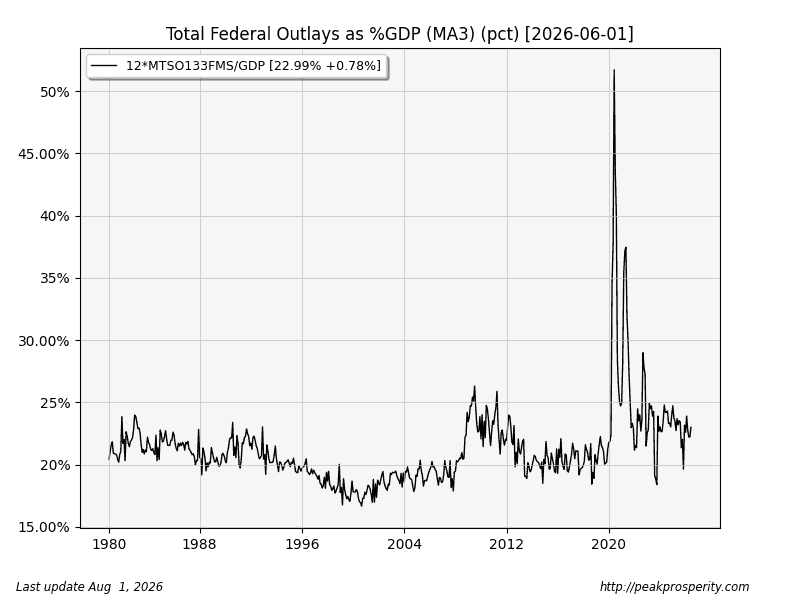
I went down a small rabbit hole; what’s the percentage of federal government spending as a percentage of GDP? Short answer: 23%. So 23% of US GDP is actually Federal government spending. Last I checked, government doesn’t actually produce anything. One example: approvals for mRNA shots. Note this doesn’t take into account “Cayman Islands” spending, the magic money machines discovered by DOGE and then covered up, and the annual trillions in “failed audits” by the Pentagon. I had to multiply by 12 because the “federal outlays” series (MTSO133FMS) is monthly, while GDP is a seasonally adjusted annual rate.
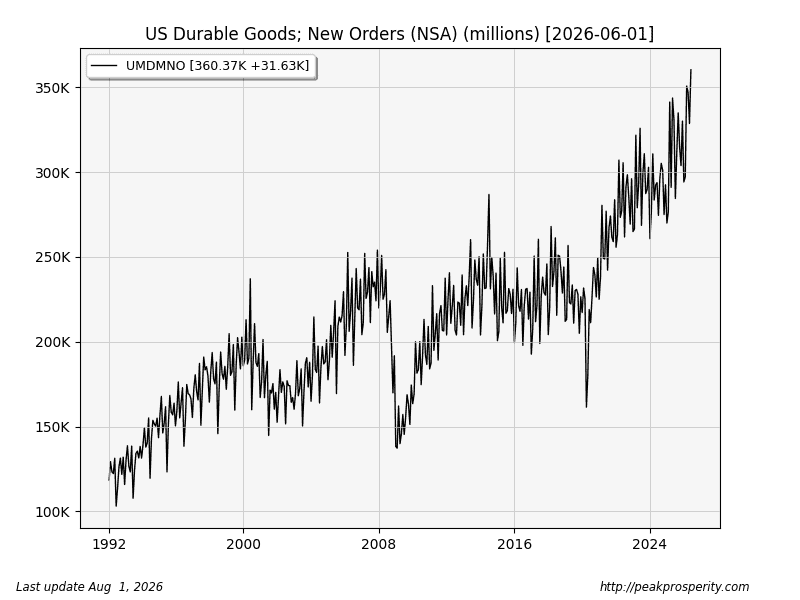
Durable Goods (orders) hit a new all-time high this month; I’m using the NSA version now, so it’s a bit choppier. “Someone” is buying a lot of “durable goods”. BOOMING!
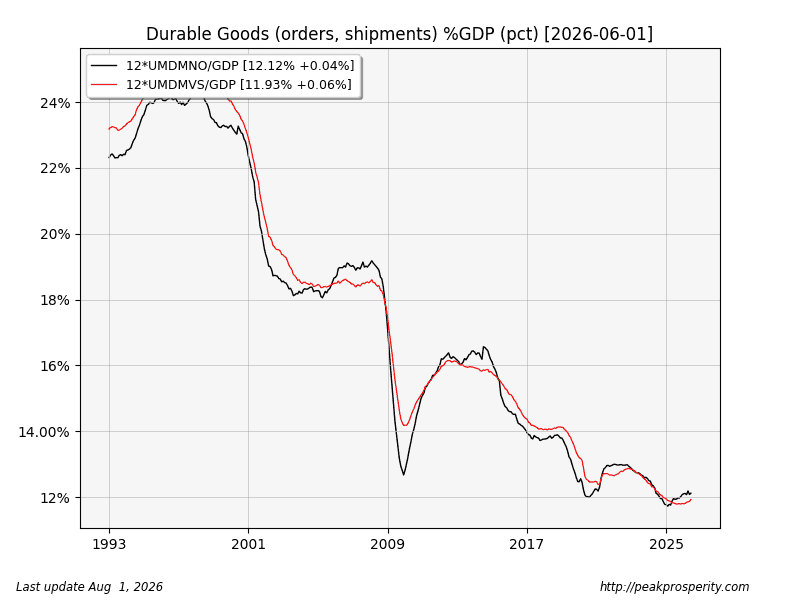
I wondered – what does it look like with a denominator? Here are orders (black line) and shipments (red line) – both monthly series – times 12, divided by (annualized) GDP, put through an MA12 to smooth out the chops.
Add a denominator, and Durable Goods (orders, and shipments) are bouncing off 30-year lows.
The full series title may explain this result: “Value of Manufacturers’ New Orders for Durable Goods Industries”
My guess: the US has lost 50% of its Manufacturers over the past 30 years. What do we manufacture these days? We do produce mRNA mandated-depopulation Fauci Ouchies, but some of those were outsourced to Mainland China, which – coincidentally – didn’t inflict them on their own population. Mistakes Were Not Made.
Auto/light truck sales moved slightly higher, but recession-indicator “Heavy
 by irishprince
