


Consumer Economy
- Durable Goods, New Orders (DGORDER) 339.2B +3.6B (+1.07% m/m)
- Median New Home Sales Price (MSPNHSUS) 393.8K -9.30K (-2.31% m/m)
- Personal Income (PI) 27.11T +115.1B (+0.43% m/m)
- Auto/Light Truck Sales (ALTSALES) 16.3M -239.0K (-1.44% m/m)
- GDP (GDP) 32.49T +620.3B (+1.95% q/q)
Durable Goods (new orders) rose 1.07%, after falling last month. It remains near all-time highs; not recessionary, but we should probably adjust it for inflation.
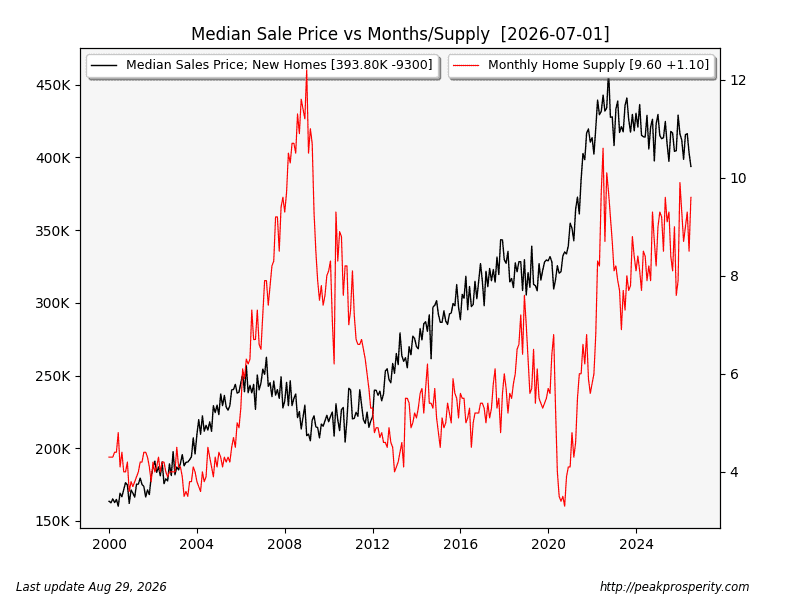
Median New Home Sales Price continues to fall – to levels last seen in 2021. Months of New Home Supply rose 1.10 to 9.60 months. The trend: falling home prices (black line), alongside rising supply (red line) = a homebuilder ouchie. It is not even close to 2008, but we can see that the months-of-supply trend has moved slowly higher over the last 10 years or so (with a blip during 2020).
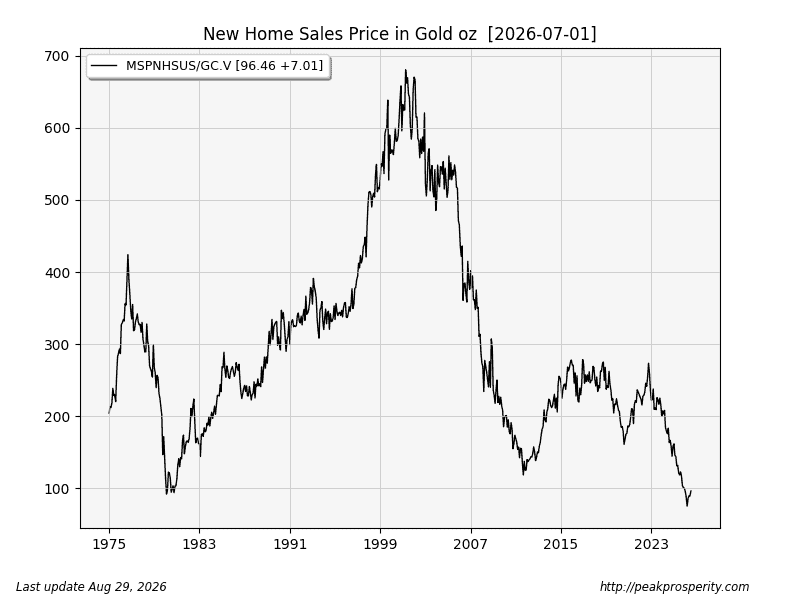
As a reminder – here are home prices adjusted for inflation using gold ounces. What are new home prices in gold ounces? Answer: It takes 96 ounces to buy a new home. If you swapped your home for ounces back in 2002…that’s at least a 6-bagger.
Personal Income rose at 0.43% this month – or 5.16% annualized. Not bad, but do we think that’s keeping up with inflation?
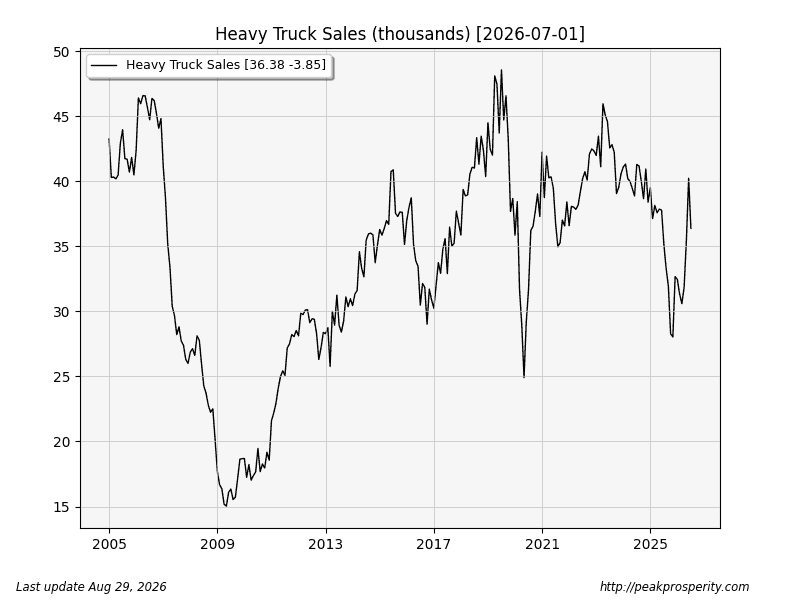
Auto Sales inched lower, but remain near the highs. Recession-indicator Heavy Truck Sales fell 3848 units (-9.57%). Is it the start of something or just a blip?
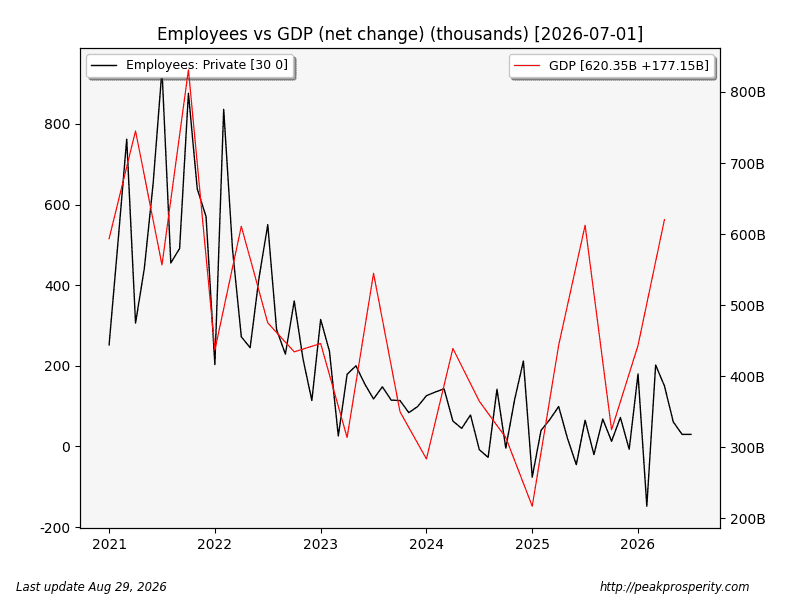
GDP rose at 7.8% annualized – that’s a big increase. I tried a “private employees vs GDP” net change chart to see if big GDP gains were resulting in job growth. The changes in employees and GDP were pretty well synced up until 2025. Today, increases in private employees (black line) look pretty lame, while GDP increases (red line) are jumping higher. I’m guessing that employees-GDP differential is about the AI data center (control grid) buildout. No employment benefits for you, little person.
Credit & Rates
- Total Bank Credit (TOTBKCR) 19.83T +33.7B (+0.17% w/w) (prior +0.05% w/w)
- Fed Balance Sheet (WALCL) 6.73T -14.8B (-0.22% w/w) (prior -0.21% w/w)
- US 30 Year Mortgage Rate (MORTGAGE30US) 6.66% +1 bp
- 3-Month Treasury (DGS3MO) 3.83% -5 bp
- 1-Year Treasury (DGS1) 4.13% +10 bp
- 10-Year Treasury (DGS10
 by davefairtex
