


Consumer Economy
- Existing Home Sales (EXHOSLUSM495S) 3.75M -220.0K (-5.54% m/m)
- CPI All Urban (CPIAUCSL) +0.35% m/m
- Producer Prices (PPIACO) 293.9 -0.55 (-0.19% m/m)
Existing Home Sales (SA) plunged to a new all-time low. But that’s not the fun part.
- Data comes from: “Copyright, 2016, National Association of Realtors. Reprinted with permission.”
- The FRED series only goes back to October 2025. They have purged all the earlier data – the older data has been wiped from FRED history.
I had a backup, which I applied a while back, but I never looked at the NSA number until today. This month, the SA version just hit a new all-time low. That’s the red line. The black line, the “NSA” (not seasonally adjusted) version, is … catastrophic.
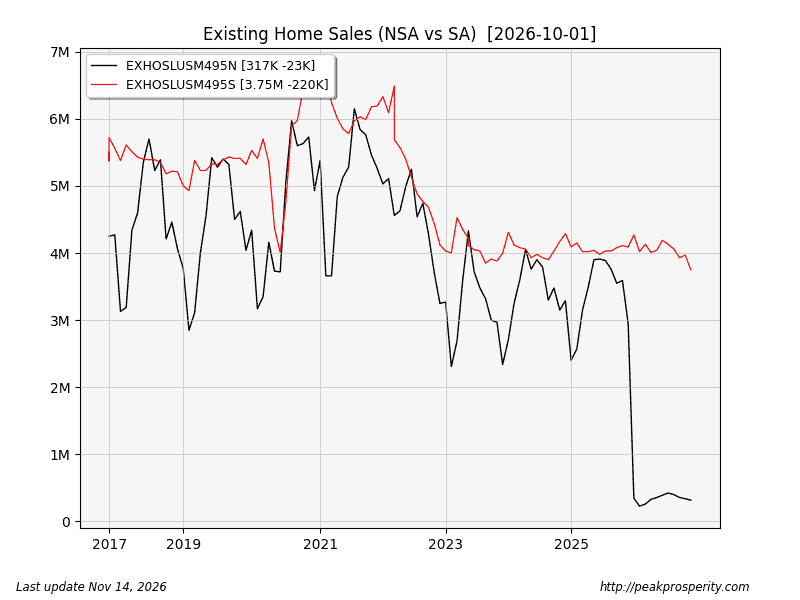
If you want to fact-check the numbers, you can go to FRED and see the latest values they have. This month, the numbers I saw were: EXHOSLUSM495N = 317k, EXHOSLUSM495S = 3.75M. That’s a 12x difference. “The power of seasonal adjustment.” Or maybe it’s a bug. I don’t know. Even if it’s just a bug, the housing market really isn’t happy.
- NSA series: https://fred.stlouisfed.org/series/EXHOSLUSM495N
- SA series: https://fred.stlouisfed.org/series/EXHOSLUSM495S
The CPI numbers were unpleasant, but the headline numbers didn’t look all that bad to me. The market’s reaction wasn’t so pleased, however. Turns out, Endless War (Bibi-flation) has a price tag. Of course, it’s spare change compared to the > 8% annual CPI inflation we saw under Senile Joe (2022). Of course, I think CPI is deliberately understated by at least 6-8%. Did this 4% (annualized) CPI justify a massive flight out of Treasuries?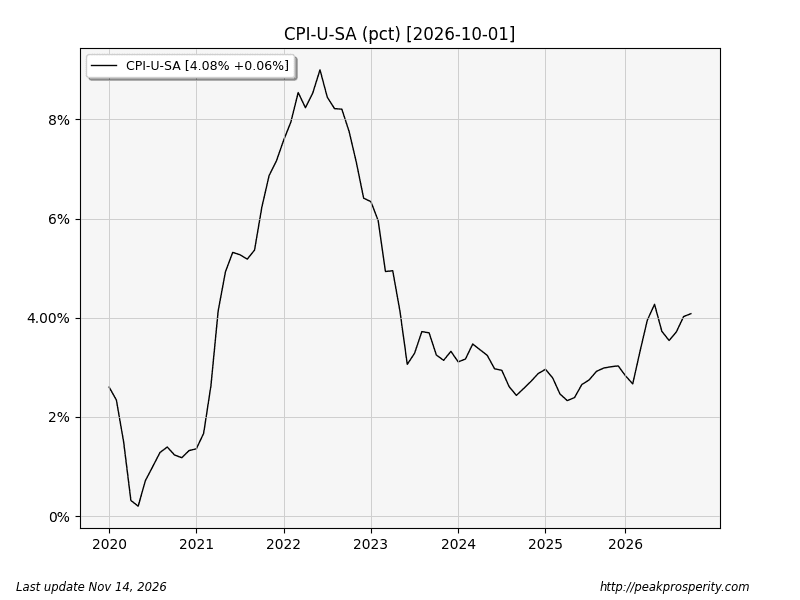
https://www.bls.gov/news.release/cpi.t01.htm#cpipress1.f.1
Cherry-picked increases:
- Food: 0.5% [6% annualized]
- Fuel Oil: 2.0% [24% annualized]
- Gasoline: 1.0% [12% annualized]
- Electricity: 0.9% [10.8% annualized]
- Hospital Services: 0.8% [9.6% annualized]
- Vaxxident repair: 0.6% [7.2% annualized]
- Vaxxident insurance: 0.7% [8.4% annualized]
Credit & Rates
- Total Bank Credit (TOTBKCR) 20.08T +58.0B (+0.29% w/w)
- Fed Balance Sheet (WALCL) 6.76T +10.7B (+0.16% w/w)
- US 30 Year Mortgage Rate (MORTGAGE30US) 7.11% -7 bp
- 3-Month Treasury (DGS3MO) 4.23% +4 bp
- 1-Year Treasury (DGS1) 4.61% +28 bp
- 5-Year Treasury (DGS5) 4.98% +34 bp
- 10-Year Treasury (DGS10) 5.15% +29 bp
- 30-Year Treasury (DGS30) 5.47% +21 bp
- 20+ Treasury ETF (TLT.N) -3.10% w/w (prior +0.10% w/w) -9.53% y/y
- Confidence in US Government (AAA10Y) 1.02%
 by redneck-engineer

