


Consumer Economy
- GDP (GDP) 31.82T +396.9B (+1.26% q/q)
- Personal Income (PI) 26.72T +0.00 (+0.00% m/m)
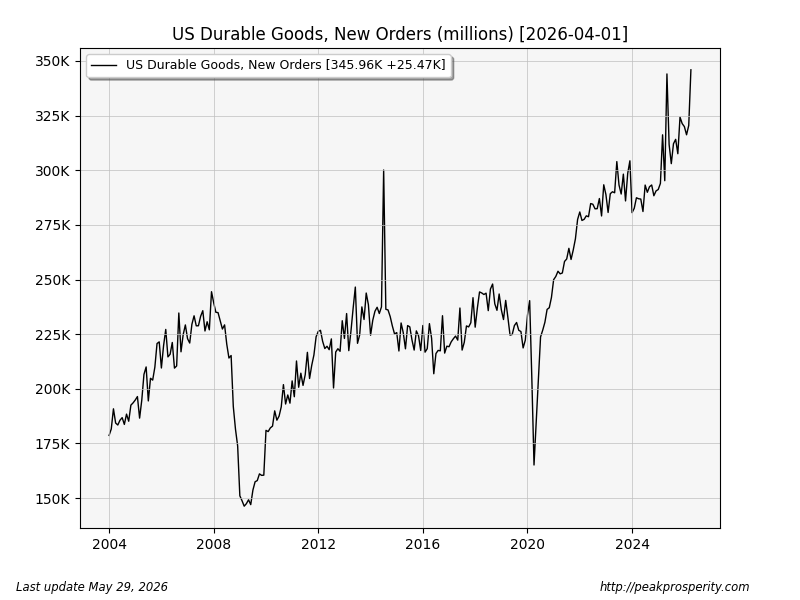
- Durable Goods, New Orders (DGORDER) 346.0B +25.5B (+7.95% m/m)
- Auto/Light Truck Sales (ALTSALES) 15.9M -249.0K (-1.54% m/m)
- Median New Home Sales Price (MSPNHSUS) 422.5K +31.4K (+8.03% m/m)
GDP (unadjusted for inflation) was decent (1.26% q/q, 5% annualized), but the little people didn’t benefit; last month’s “personal income” was unchanged. Is that just a bug? I checked FRED, and it shows no change from March to April. That’s the monthly data (PI); the quarterly data (PINCOME) was up 0.81% q/q, or 3.24% annualized.
Even if we ignore the unchanged PI because it’s a “bug”, an annualized increase of (quarterly) PINCOME at 3% is not keeping up with (at least 6%) Bibi-flation.
Durable Goods/Orders shot up to a new all-time high; the 8% jump (m/m) was massive. It looks like “some people” are ordering tons of “durable goods” like mad right now. Perhaps: 1) data centers and AI, and/or 2) buying ahead of the expectation of massive Bibi-flation ahead. The last time we saw moves like this was back during the Trump Tariff Terror (March and May, 2025).
Auto/light truck sales didn’t change much – they are mostly chopping sideways at reasonably strong levels. Recession-indicator Heavy Truck sales jumped higher – they are still recovering off the lows set last November. Not recessionary.
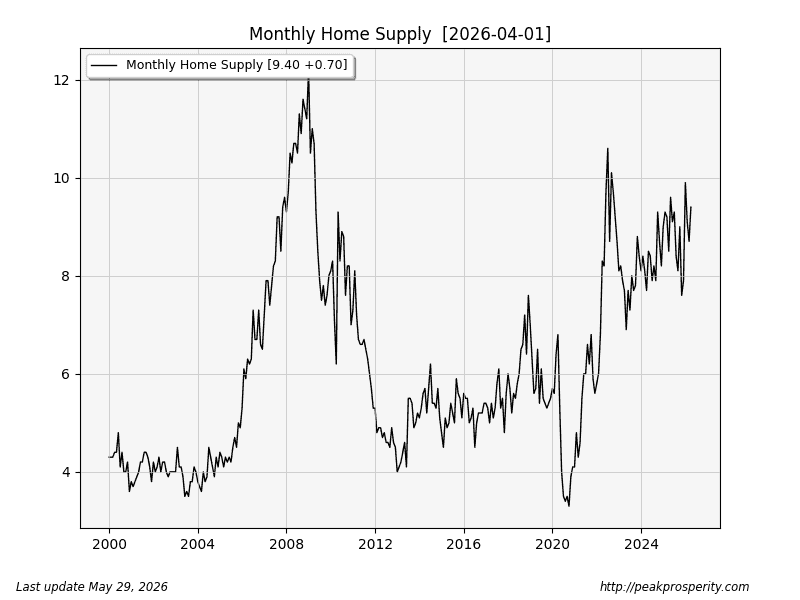
Median new home sales prices rebounded this month; the trend is overall lower, but it improved with this report. That said, new home supply moved higher (+0.7 months): it is now at 9.4 months, while New Home Sales (HSN1F) fell by 6%. Back during the 2008 housing bubble, the months of supply peaked at 12 months. A happy “months of supply” level is around 4-6 months.
My interpretation: sellers are raising prices (sales price increases), but the buyers aren’t going for it (months of supply increases, while the number of homes sold drops). Ultimately, “MSACSR” is the smoking gun.
Credit & Rates
- Total Bank Credit (TOTBKCR) 19.57T +33.5B (+0.17% w/w)
- Fed Balance Sheet (WALCL) 6.70T -9.3B (-0.14% w/w)
- US 30 Year Mortgage Rate (MORTGAGE30US) 6.53% +2 bp
- 3-Month Treasury (DGS3MO) 3.68% +0 bp
- 1-Year Treasury (DGS1) 3.78% -8 bp
- 10-Year Treasury (DGS10) 4.44% -12 bp
- 20+ Treasury
 by desert-survivor
