


Consumer Economy
- Retail Sales (RSAFS) 768.6B +1.7B (+0.22% m/m)
- Industrial Production (INDPRO) 102.6 +0.08 (+0.08% m/m)
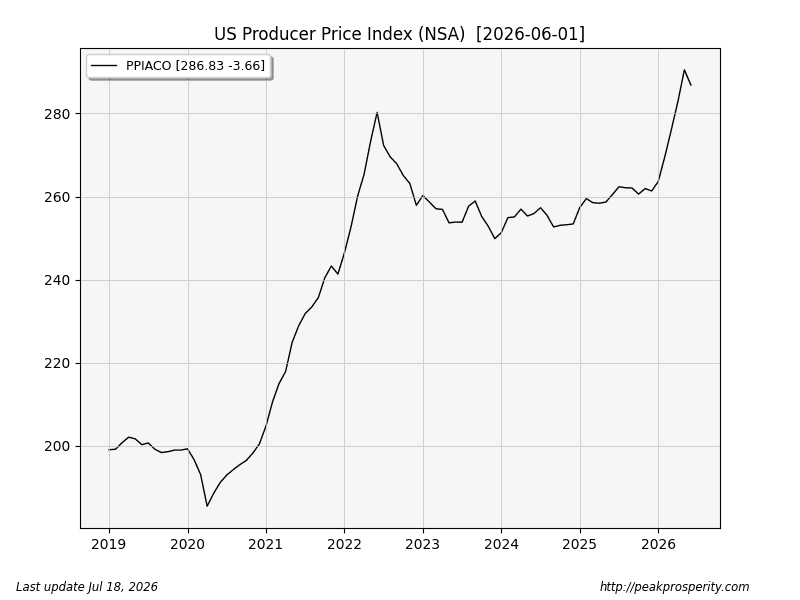
- Producer Prices (PPIACO) 286.8 -3.66 (-1.26% m/m)
- CPI All Urban (CPIAUCSL) -0.42% m/m (prior +0.47% m/m)
Retail Sales were not BOOMING this month; they rose an annualized 2.64%. One contributor: gasoline stations, which dropped by 5.2% ($3.4 billion) vs last month, which subtracted 0.44% from the overall sales numbers. Also declining m/m: Groceries (-0.41%), Health/Personal Care (-0.81%), Clothing (-0.31%), Food & Bev (-0.19%). Details: stlouisfed.org.
Little people reducing spending on groceries, clothing, health care, food & bev = Recessionary.
Industrial Production inched higher (about 1% annualized); not BOOMING.
Both CPI and PPI declined; you can see the magnitude of the PPI decline (yawn) in the PPI chart below. Note this is the old series (PPIACO) vs the “final demand” series. “Just commodities, thanks.”
The 0.42% CPI decline drove prices on Tuesday.
CPI sector m/m changes: Food (+0.2%), Energy (-4.9%), Furnishings (0.0%), Apparel (-1.2%), Transport commodities (+0.7%), Medical Care Commodities (-0.2%), Recreational Commodities (+1.0%), Education/Communication (-0.7%), Services (0.0%).
If you want to look at what BLS says inflation was, per sector: bls.gov.
Credit & Rates
- Total Bank Credit (TOTBKCR) 19.64T +28.9B (+0.15% w/w)
- Fed Balance Sheet (WALCL) 6.74T +7.4B (+0.11% w/w)
- US 30 Year Mortgage Rate (MORTGAGE30US) 6.55% +6 bp
- 3-Month Treasury (DGS3MO) 3.80% -5 bp
- 1-Year Treasury (DGS1) 4.00% -6 bp
- 10-Year Treasury (DGS10) 4.55% -1 bp
- 20+ Treasury ETF (TLT.N) +0.06% w/w (prior -1.22% w/w)
Bank credit rose 29B, which eliminated most of last week’s 36B drop. We have still not been back in positive territory for the past few weeks.
The Fed printed money this week (7.4B); that’s the second week of increase.
Here’s a chart showing the weekly bank credit increase alongside the weekly Fed printing, put through an MA4 to eliminate (some of) the chaos. The Fed (black line) was negative-printing until late December 2025. Except for one moment at the start of 2026, Bank Credit (red line) net change has been larger than Fed printing, but the weekly change in bank credit (i.e., values > 0) looks to be shrinking. The “break-even” level for bank credit is around +19 billion per week (+5% y/y). Anything less = deflationary. Right now,
 by tycernc
