


- GDP (GDP) 33.01T +447.0B (+1.37% q/q)
- Personal Income (PINCOME) 27.64T +271.8B (+0.99% q/q)
- Personal Income (PI) 27.71T +54.4B (+0.20% m/m)
- Durable Goods, New Orders (DGORDER) 345.4B +6.3B (+1.84% m/m)
- Median New Home Sales Price (MSPNHSUS) 400.4K +15.0K (+3.89% m/m)
Q3 GDP (unadjusted for inflation) screamed higher, up 1.37% [5.48% annualized]. BOOMING!
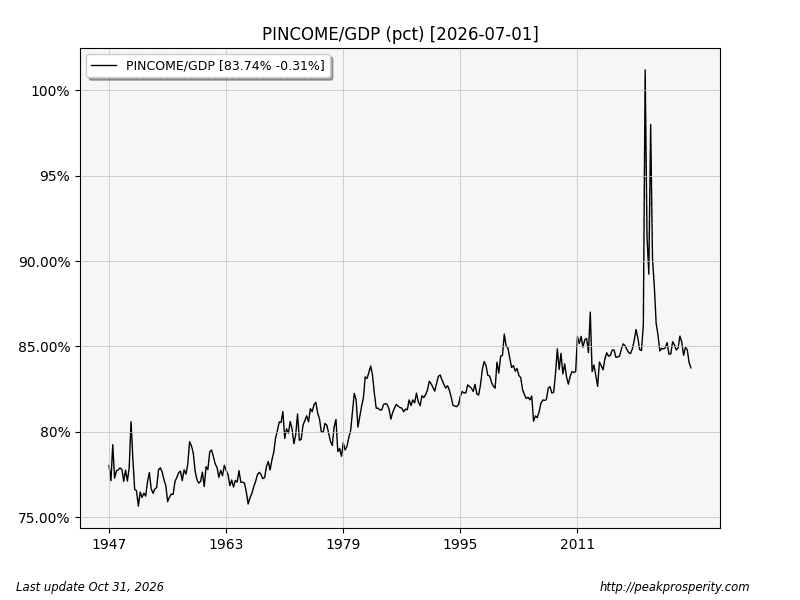
Personal Income rose too, but only 0.99% over that same quarter [+3.96% annualized], and last month, personal income came in at 0.2% m/m [+2.4% annualized]. The little people aren’t seeing as much of a GDP boom.
Here’s a chart showing the little-people share (personal income) of GDP.
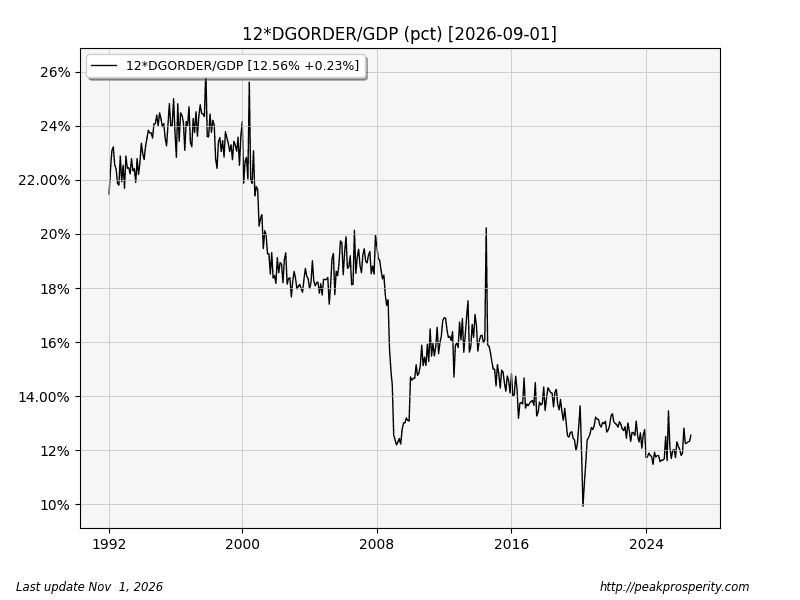
Durable Goods (Orders) increased, but it was not a new high, and this is a dollar amount, not an index. Here’s Durable Goods divided by GDP. To see what percentage of GDP that durable goods comprises, we multiply by 12 since DGORDER is a monthly series, and GDP is an “annual rate.” Who would have thought that the 90s were a Golden Age for durable goods as a percentage of GDP? At least we aren’t at (2024) Senile Joe lows any longer. The current value: not recessionary.
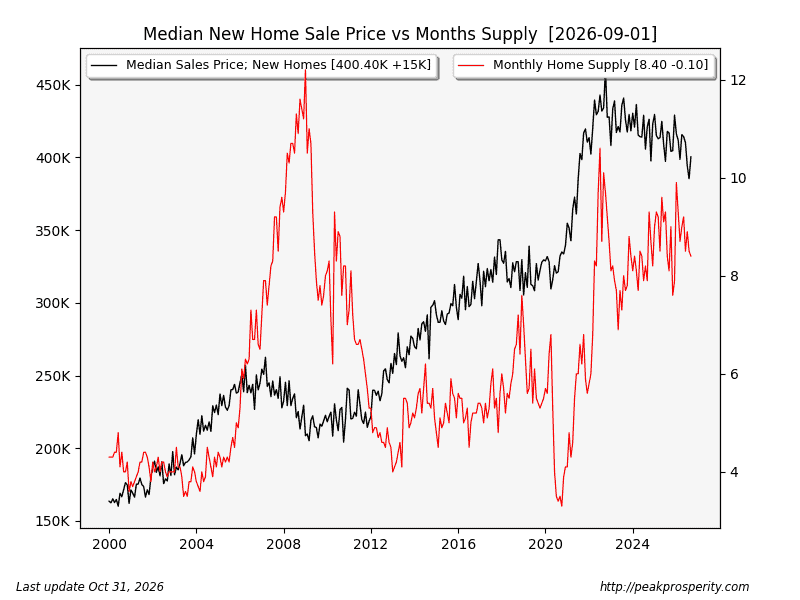
New Home Sales Price moved higher, but that’s off 5-year lows. Months of home supply moved lower, but it remains in unhappy territory at 8.4 months. Here is the combination of median new home sales price, alongside monthly home supply. If I divided the new home sale price by GDP or M2, it would look pretty ugly.
Credit & Rates
- Total Bank Credit (TOTBKCR) 20.01T +28.9B (+0.14% w/w) (prior +0.23% w/w)
- Fed Balance Sheet (WALCL) 6.75T -8.0B (-0.12% w/w) (prior -0.03% w/w)
- US 30 Year Mortgage Rate (MORTGAGE30US) 7.24% -8 bp
- 3-Month Treasury (DGS3MO) 4.09% -13 bp
- 1-Year Treasury (DGS1) 4.38% -6 bp
- 5-Year Treasury (DGS5) 4.73% -9 bp
- 10-Year Treasury (DGS10) 4.93% -7 bp
- 30-Year Treasury (DGS30) 5.31% -2 bp
- 20+ Treasury ETF (TLT.N) +0.61% w/w
- Confidence in US Government (AAA10Y) 1.00% +2 bp
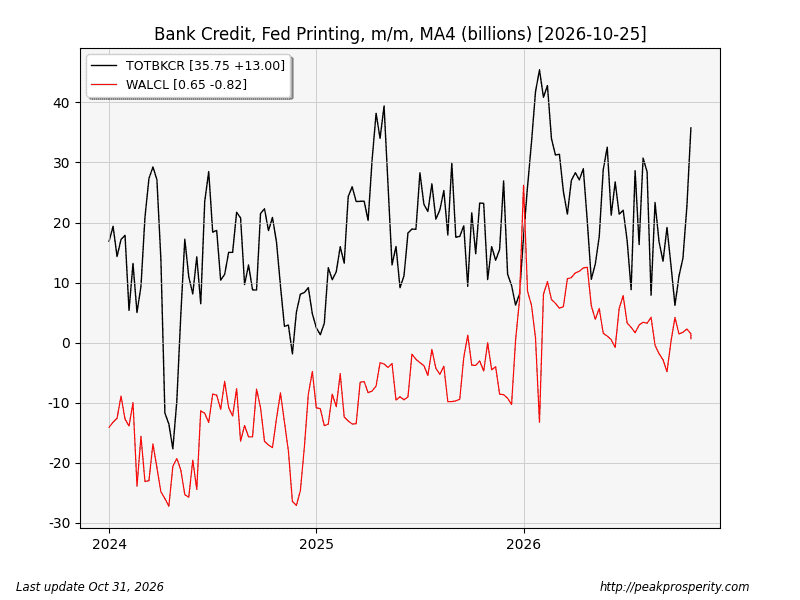
This week saw another strong expansion of bank credit [+29B], with the MA4 up around +36B/week. That’s very expansionary. At the same time, the Fed reverse-printed 8B. Bank credit growth with negative Fed printing is inflationary, but not due to the Fed.
Rates fell, but mostly
 by flyingdoc

