


Consumer Economy
- Durable Goods, New Orders (DGORDER) 338.6B -58.00M (-0.02% m/m)
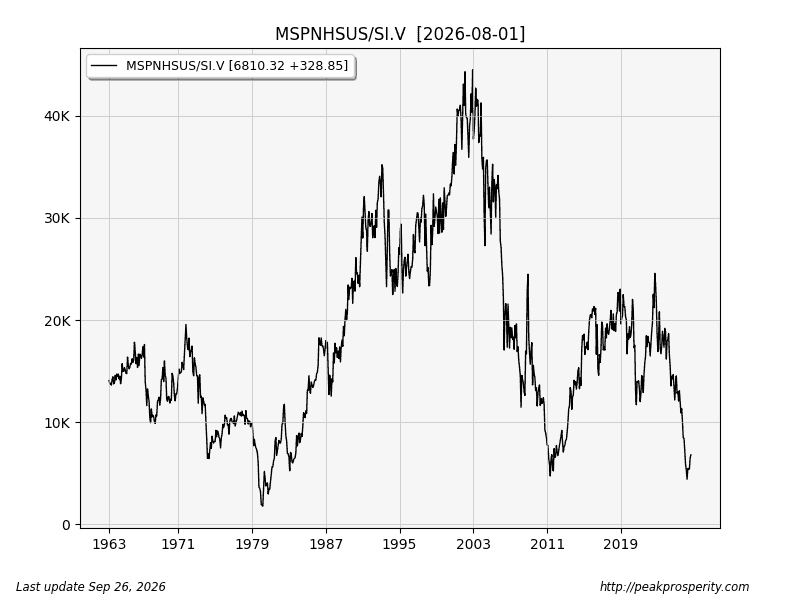
- Median New Home Sales Price (MSPNHSUS) 393.7K +1.50K (+0.38% m/m)
Durable Goods orders inched lower, but remain near all-time highs. Of course, this series is in dollars; adjusted by the price of silver, DGORDER is near all-time lows.
Median New Home Sales price looks much worse; price is bouncing off 5-year lows.
Adjusted by the price of silver – not an all-time low, but fairly close. If “property taxes” weren’t so irritating, swapping those silver bars for a home might not be a bad trade.
Property tax rates (rocketmortgage): High = New Jersey [1.88%], Low = Hawaii [0.29%]. Taxes (currently) for your silver bars: 0%. Until it becomes a “strategic metal” ($600 silver – unobtainium!), and then who knows.
A “property tax” of 1.88% x 20 years = reduction by 32%. Of course an “inflation tax” of 8% per year for 20 years is substantially worse; it’s an 81% reduction.
Credit & Rates
- Total Bank Credit (TOTBKCR) 19.88T +9.5B (+0.05% w/w)
- Fed Balance Sheet (WALCL) 6.75T +1.2B (+0.02% w/w)
- US 30 Year Mortgage Rate (MORTGAGE30US) 7.03% +8 bp
- 1-Month Treasury (DGS1MO) 3.96% -1 bp
- 3-Month Treasury (DGS3MO) 4.18% +4 bp
- 1-Year Treasury (DGS1) 4.48% +4 bp
- 5-Year Treasury (DGS5) 5.0% +14 bp
- 10-Year Treasury (DGS10) 5.17% +16 bp
- 30-Year Treasury (DGS30) 5.50% +16 bp
- 20+ Treasury ETF (TLT.N) -2.38% w/w
- US Confidence (AAA10Y) 0.95% -2 bp
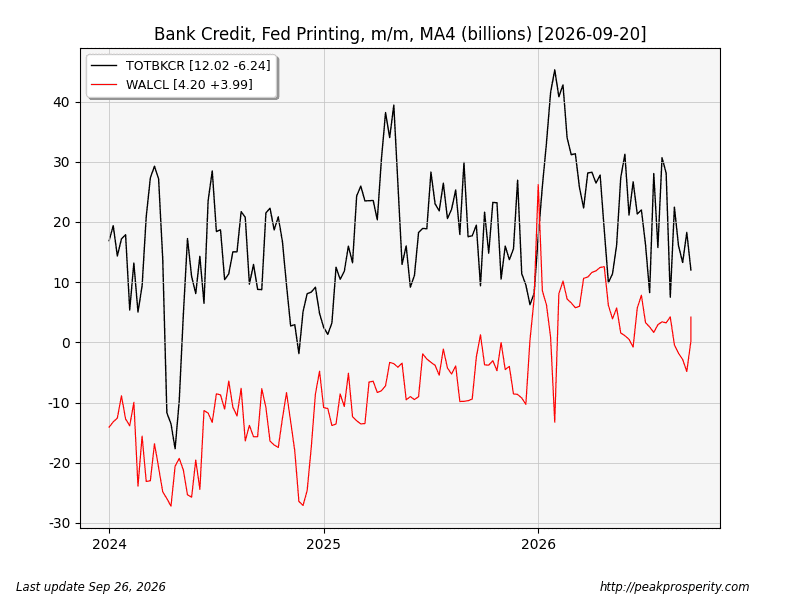
Bank credit did not grow enough (+9.5B), while the Fed printed just 1.2 billion. The MA4 of bank credit growth continues lower (+12M), which looks deflationary to me.
Rates mostly screamed higher, especially at the long end of the curve. A 16 basis point increase is not a small move. The only steady rate was the 1-month, while the 3-month is hinting at another rate increase to come.
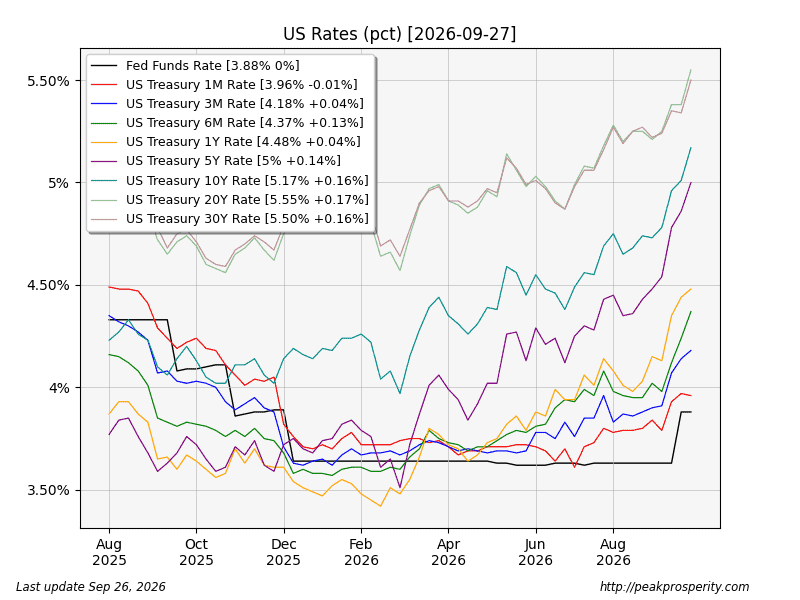
As a result of the 16-17 bp increase, TLT (20+ Treasury ETF) plunged 2.38%, which was a new all-time low. While recent moves in TLT seem pretty dramatic (and I’m glad I don’t have it anymore), I’ll present a 25-year (yearly) chart for TLT dating back to 2002. The biggest move in TLT? Senile Joe 2022: -33%. Does anyone remember this happening?
 by mike-from-jersey
