

Consumer Economy
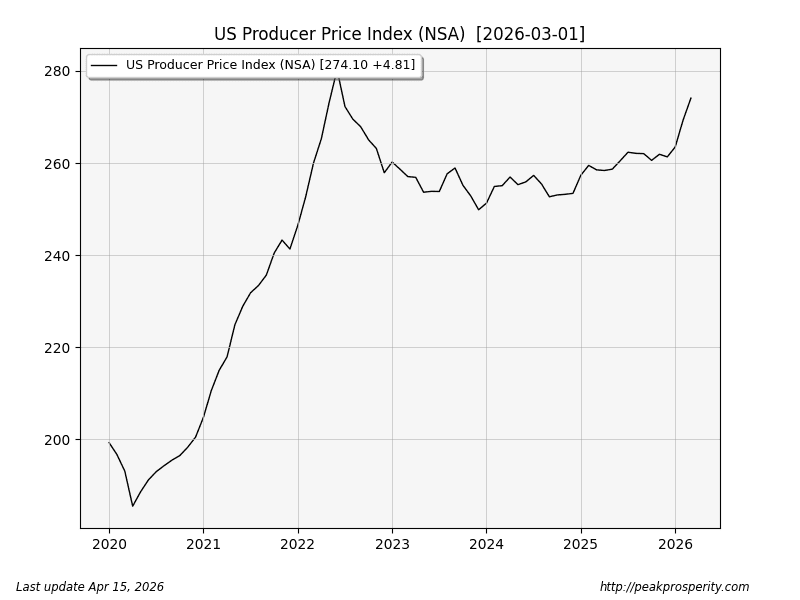
- Producer Price Index (PPIACO) 274.1 +4.81 (+1.78% m/m)
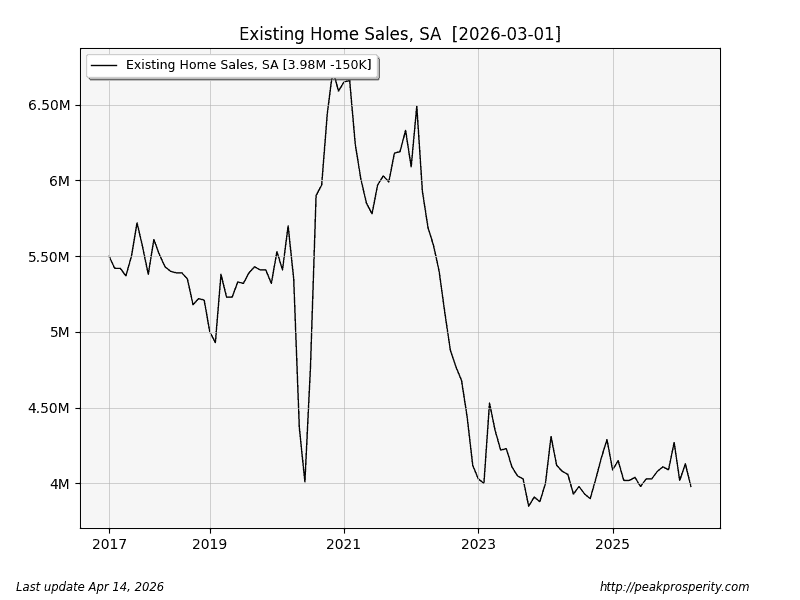
- Existing Home Sales (EXHOSLUSM495S) 3.98M -150.0K (-3.63% m/m)
- Industrial Production (INDPRO) 101.79 -0.55 (-0.54% m/m)
Producer prices jumped 1.78% – or +21.36% if it happens for the next 12 months. It looks like we’re starting to do a re-run of Senile Joe Biden-flation. Note the “more popular” PPI Final Demand (PPIFID) moved up by “just” 0.73% m/m. I use PPIACO since it seems more valid.
Existing home sales inched lower – they remain near 8-year lows. That’s recessionary, especially for housing. With the new Trump-war-flation (Bibi-flation?), will we see housing break down even further?
Industrial production actually declined. It wasn’t horrific, but it does hint at recession.
Credit & Rates
- Total Bank Credit (TOTBKCR) 19.46T +36.9B (+0.19% w/w)
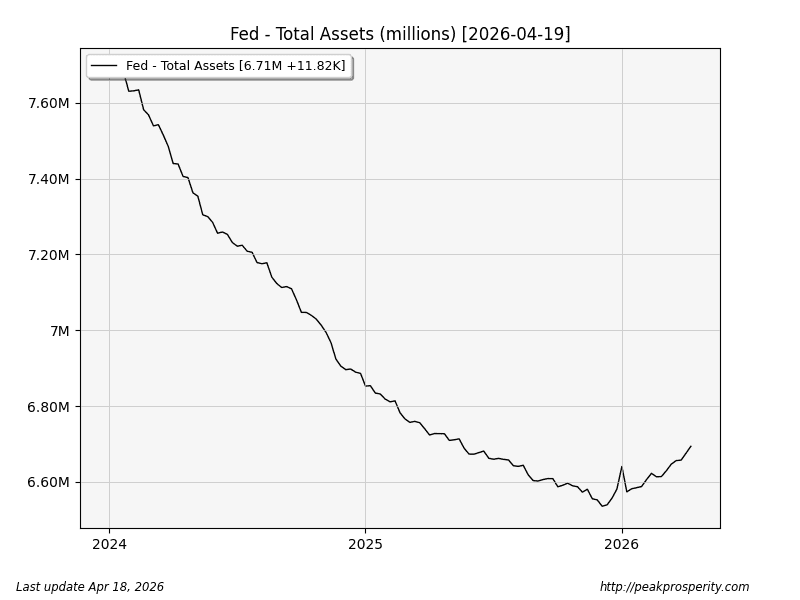
- Fed Balance Sheet (WALCL) 6.71T +11.8B (+0.18% w/w)
- US 30 Year Mortgage Rate (MORTGAGE30US) 6.37% -9 bp
- 3-Month Treasury (DGS3MO) 3.69% +0 bp
- 1-Year Treasury (DGS1) 3.63% -7 bp
- 10-Year Treasury (DGS10) 4.23% -8 bp
- 20+ Treasury ETF (TLT.N) +0.67% w/w
- US Confidence (AAA-10Y) 1.10% unchanged
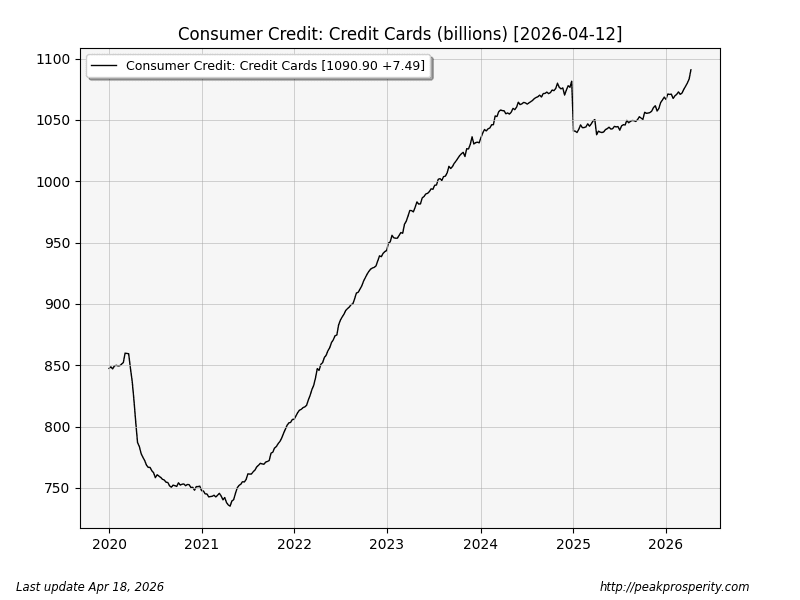
Bank credit expanded [+9.9% annualized]; going down the rabbit hole, it was (w/w): Credit Cards [+0.69%], Commercial & Industrial [+0.32%], All Other Loans/Leases [+0.20%]. Note that Residential Real Estate declined [-0.03%].
The big increase [$7.5 billion] in credit card lending this week = a BOOMING economy. [It’s a joke, son]. Annualized, that’s a 36% increase. Those credit cards have 29% interest rates these days. Safe & Effective. Save Grandma. And so on.
The Fed continued money printing; this week, $11.8 billion. The annual rate is about $613 billion. Money printing is now happening every week. Given the economy is BOOMING, why on earth would they print so continuously?
Rates continue to move lower, with most of the move happening in the middle of the curve (1-10 years). Most of these moves happened on “Hormuz is Open Yet Again!” Friday.
One might think that the constant (let’s call it) “state of confusion” coming out of Truth Social might bring about a collapse of confidence, yet nothing got worse this week, at least through Thursday in the AAA-10Y yield spread. It was unchanged.
Here’s the TLT daily chart, which provides a decent look at 20-year treasury yield movements over
 by thecountmc
