

Snippets From Dave’s Discussion:
We are seeing more-than-hints of contraction right now in the monthly data: PPI, Retail Sales, Industrial Production, along with somewhat-ill “Doctor Copper”, and crude oil at $61.
Trump’s trip to the Middle East appeared to kick both Bibi and Zelensky to the curb. My sense is, Saudi Arabia et al have made peace with Iran (Shia meets Sunni with no fighting – not something I would have predicted) and Trump is going along with all of it. And/or Trump facilitated it behind the scenes. The level of glee was palpable.
Consumer Economy
Producer Prices (PPIACO); 258.7 +0.00, (+0.00% m/m)
Industrial Production (INDPRO); 103.9 -0.01 (-0.01% m/m)
Retail Sales (RSAFS); $724B +417M (+0.06% m/m)
CPI All Urban (CPIAUCSL); +0.22% m/m (2.64% annualized)
Both the Producer Price Index and the Industrial Production Index came in flat. That hints at contraction.
Retail Sales (unadjusted for inflation) inched higher (0.72% annualized). At the same time, CPI inflation has fallen (this month) closer to the Fed’s “2%” level. Given inflation is understated by about 8%, that makes the tiny Retail Sales increase quite contractionary.
Wolf Richter has his usual breakdown (source – wolfstreet);
My cherry-picked core services:
+ medical (vax-injury/pharma-extraction) care & insurance: +0.5% m/m
+ auto (vaxxident) insurance: +0.6% m/m
+ auto (vaxxident) repair: +0.7% m/m
The Safe & Effective continues to cause “inflation” in selected sectors.
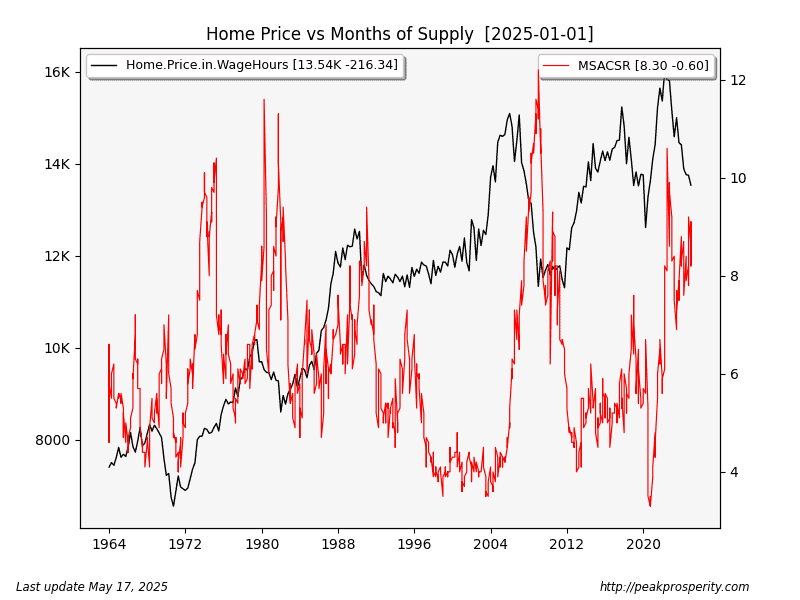
Chris did an interesting overview of housing in various regions; long ago I constructed a series using median home sales price (MSPUS) divided by the average hourly earnings (AHETPI). Concept: how many work-hours would it take for the average person (currently: $31/hour) to buy the average-priced home. I went and printed the latest chart, along with months-of-home-supply (MSACSR). Although the indicator didn’t work so well during the 1970s, since then a “bullish” number for home supply is 4 months, “average” at 6 months, “bearish” at 8 months, and “very bearish” at 10+ months.
In terms of wage-hours required, the average home price topped out in 2022 at 16k hours, and we’ve been in a “falling market” since then. Given home supply remains > 8 months – that’s probably not good news for the trend. Of course, these are national numbers, and real estate tends to be very local, so YMMV.
Overall, this looks
 by cmartenson
