

(…) This will drive the Fed to cut rates and maybe even resume money printing, but I claim that “Fed money printing” isn’t as effective as “magic money printing” which shoves the cash directly into the pockets of spenders – similar to those $1200 “Covid” stimulus checks. In other words, Fed money printing might not work. And this is Trump=Hitler we’re talking about. Why would the Fed print money with him in office?
That CME tool is suggesting just a 10% chance of a cut. Powell would be jawboning if he didn’t agree.
Consumer Economy
Retail Sales (RSAFS); $722B +10.3B, (+1.43% m/m)
Durable Goods, New Orders (DGORDER); $316B +26.6B (+8.42% m/m)
Median New Home Sales Price (MSPNHSUS); $403.6K -7.90K (-1.96% m/m)
Existing Home Sales (EXHOSLUSM495S); 4.020M -250.0K (-6.22% m/m)
Retail Sales shot higher (17% annualized), while the rise in Durable Goods Orders was even more absurd – 101% annualized. Tariff-front-running, I suspect. The big DGORDER move is worth a chart:

New Home Sales Price fell by about 2%, new home supply fell by 7%, and the total number of new homes sold rose by about 7%. Perhaps dropping prices have helped new home sales? Or maybe it’s that pull-forward effect – people are worried about “new home construction getting more expensive” due to tariffs.
Existing Home Sales moved down 6%; that’s not a new low, but it is getting close, while prices increased by 2.8%. Interesting how existing (used) home sales fell, while new home sales rose.

Credit & Rates
Fed Balance Sheet (WALCL); 6.727T -183M, (-0.00% w/w)
Total Bank Credit (TOTBKCR); 18.302T +78.8B, (+0.43% w/w)
30 Year Mortgage Rate (MORTGAGE30US); 6.81% -2 bp
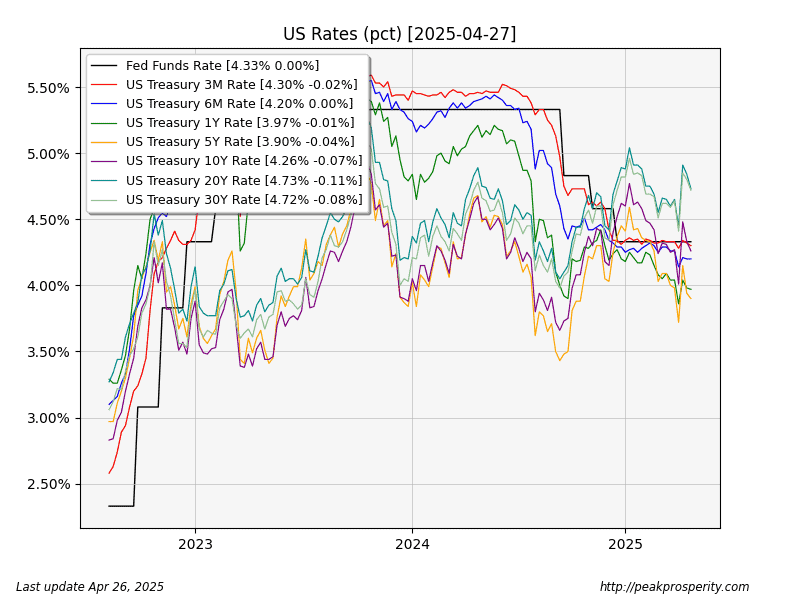
10 Year Treasury (DGS10); 4.26% -7 bp
20+ Year Bond Fund (TLT); 88.89 +1.55%
Bank credit (TOTBKCR) screamed higher; the +0.43% weekly increase is a 22% annualized increase. Borrowed money for tariff front-running is my current model.
Money flowed into the long end of the curve – the 20-year saw the largest decline, dropping 11 bp, which caused TLT to have a nice gain of 1.5%. Still, TLT remains in a downtrend, so the rate trend remains higher.
Mockingbird Media sees horrible news attached to “the trade war”. If only the Cackler had been elected, instead of Orange Hitler,
 by quercus-bicolor-2
