

Consumer Economy
- Existing Home Sales (EXHOSLUSM495S) 4.02M +10.0K (+0.25% m/m)
- Retail Sales (RSAFS) 757.1B +3.7B (+0.49% m/m)
- Industrial Production (INDPRO) 102.5 +0.69 (+0.68% m/m)
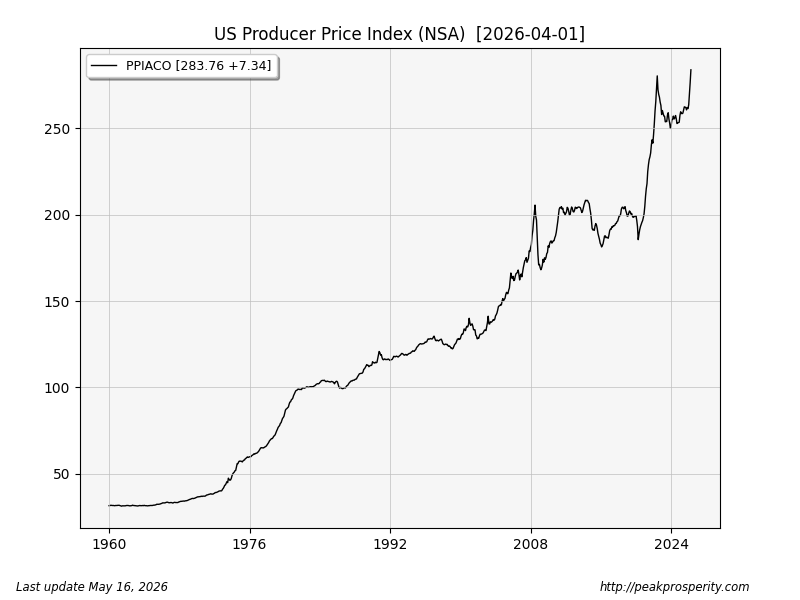
- Producer Prices (PPIACO) 283.8 +7.34 (+2.66% m/m)
- CPI All Urban (CPIAUCSL) +0.64% m/m
Existing Home Sales were mostly unchanged, bouncing around at one-decade lows.
Retail Sales rose m/m (6% annualized), but not in every sector. Motor Vehicle sales fell [-0.45%], as did Clothing [-1.46%], while Non-Store sales rose [+1.1%] along with Food & Beverage sales [+0.79%]. You can go look at the complicated table at census.gov – there are lots of adjustments.
Industrial production rose, as did manufacturing. These are indexes, not dollar amounts, so that’s a positive sign – things are slowly improving, but as of yet, no new all-time high. In fact, things were better under Senile Joe (2022-2023).
Producer price index (the old one, not “PPI final demand”) rose to a new all-time high this week – 32% annualized (12 x 2.66%). That’s absurdly inflationary. First, a chart of the index – all-time high. We are moving back into Biden-flation, just in time for the midterms. Does anyone remember the line, “It’s the economy, stupid?”
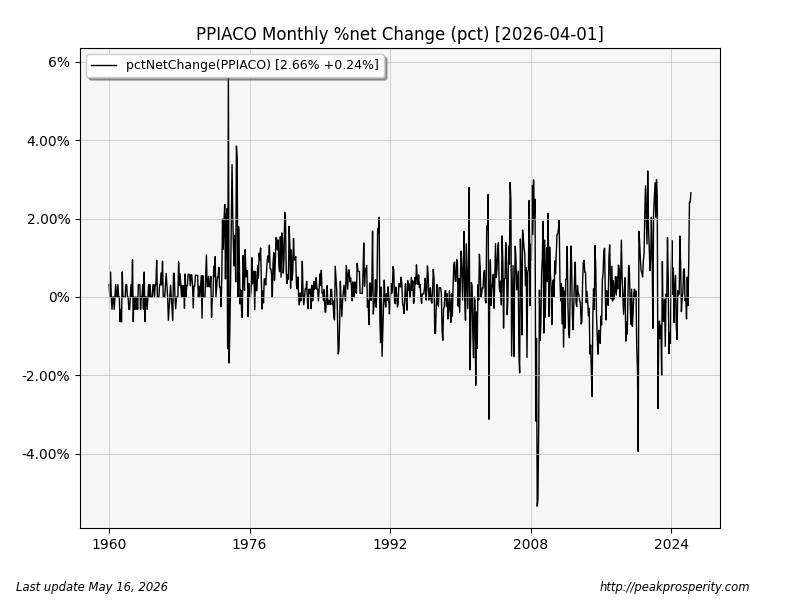
And second, the % net change month/month. You can see how relatively rare a 2.66% monthly PPI change appears. Last time it happened: back during Senile Joe. If it breaks above 4% (m/m), that’s early-70s territory.
The grossly “adjusted” CPI was up 0.64% this month, or 7.68% annualized. That’s a teensy bit above the Fed’s alleged target of 2%. “Welcome to the Fed, Warsh.” He was approved by the Senate (54-45) on Wednesday.
Cherry-picking CPI data from bls.gov, I see (Col 6):
- Overall (Unadjusted): 0.9% m/m
- Energy Commodities +10.8% m/m (March: +29.2%)
- Gasoline +11.1% m/m (March: +28.4%)
- Airline Fares +6.3% m/m (March: +20.7%)
Year/Year changes (Col 5):
- Fuel Oil +54.3% y/y
- Gasoline +28.4% y/y
- Airline Fares +20.7% y/y
Note: They say PPI leads CPI, so that means we are just getting started. The chart below is a combination of the CPI index (black) and the % change y/y (red). The y/y change is less volatile than the m/m change I did for PPI. Kinda interesting how that index keeps rising even with the Fed’s “2% inflation target” – which looks more like 2.5%, best case, even with all the CPI “adjustments” (corruption) that appeared
 by peakprosperjimpus
