

Consumer Economy
- Durable Goods, New Orders (DGORDER) 321.3B -28.00M (-0.01% m/m)
- Median New Home Sales Price (MSPNHSUS) 400.5K -18.7K (-4.46% m/m)
- Industrial Production (INDPRO) 102.6 +0.15 (+0.15% m/m)
- Producer Prices (PPIACO) 267.8 +5.46 (+2.08% m/m)
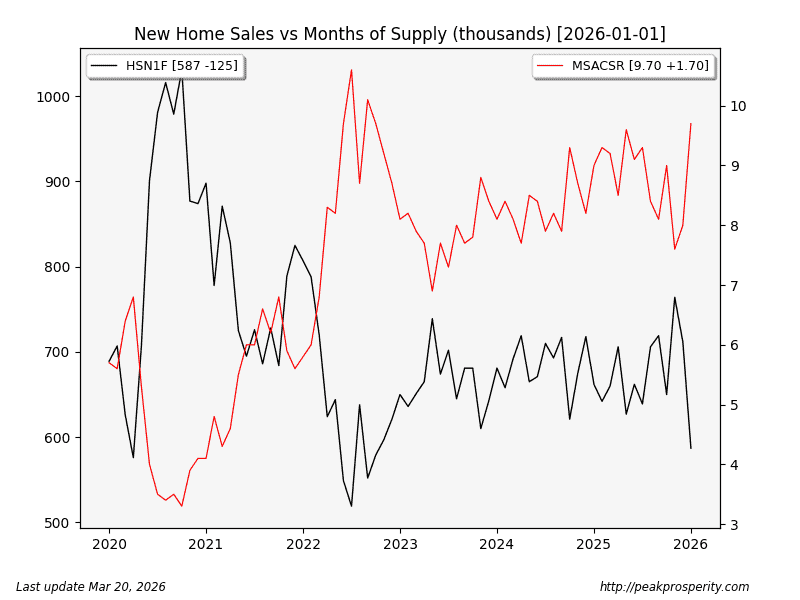
Pre-War [January] New Home Sales (HSN1F) fell by 125k units (-17.56%); median new home sale price fell $29k (-6.77%), and months of home supply (MSACSR) rose by 0.70 to 9.70 months. Black line goes down (sales fell), red line goes up (supply increases) = a bad housing environment. Of course, this is national data, and real estate is local, so YMMV, but it might explain why homebuilder stocks aren’t doing so well right now.
Industrial Production was mostly unchanged, but the levels remain relatively positive.
Pre-War [February] Producer Prices [an index] surged higher – annualized, it was a 25% change. That’s inflationary. Note, I use the old version of PPI (PPIACO) that dates back to 1913. One wonders what PPIACO will look like once the post-war data rolls in. Will we be back to Biden-flation-land? I’m guessing part of this month’s move came from the metals rally.

Credit & Rates
- Total Bank Credit (TOTBKCR) 19.34T +36.9B (+0.19% w/w)
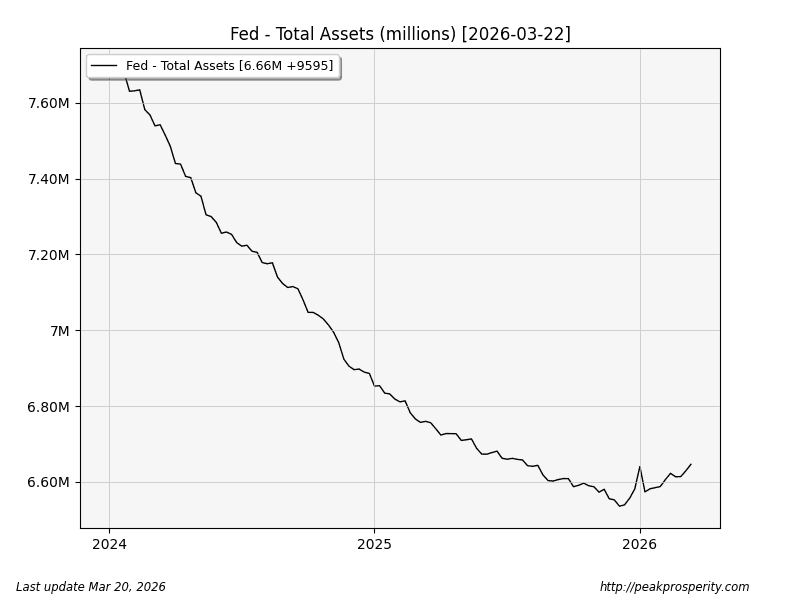
- Fed Balance Sheet (WALCL) 6.66T +9.6B (+0.14% w/w)
- US 30 Year Mortgage Rate (MORTGAGE30US) 6.22% +11 bp
- 3-Month Treasury (DGS3MO) 3.71% -1 bp
- 1-Year Treasury (DGS1) 3.80% +14 bp
- 10-Year Treasury (DGS10) 4.37% +9 bp
- 20+ Treasury ETF (TLT.N) -0.82% w/w (prior -2.17% w/w) -2.18% y/y
Bank credit: expanded again this week. Not deflationary.
At the FOMC meeting, they kept rates the same. Wolf has the details:
Fed Holds Rates, now with Only 1 Dissenter, Sees Accelerating Inflation & GDP Growth [Mar 18]
(source – wolfstreet)
The Fed printed money again this week (+9.6 billion) – the balance sheet broke out to a new 8-month high! That sounds horrific (and is probably fantastic for your tweet’s “reach”), unless you zoom out a bit.
Rate changes this week were all over the map. The 3-month Treasury actually fell [-1 bp], while the 1-year jumped by +14 bp. Curiously, the 30-year only rose by 4 bp. What does this all say? Why are they beating on the 1-year?
My guess: the market is predicting no short-term rate changes (1-3 months –
 by kronto
