

Consumer Economy
Durable Goods, New Orders (DGORDER) 312B +8.9B (+2.84% m/m)
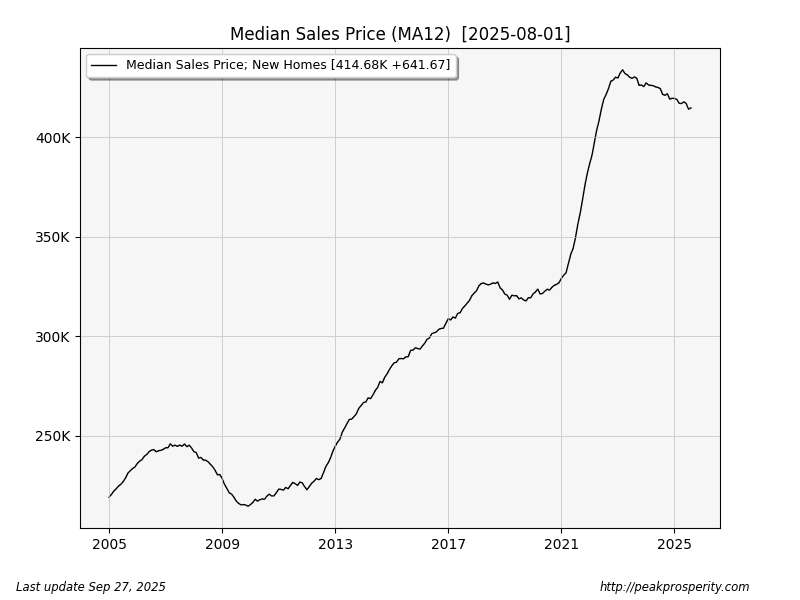
Median New Home Sales Price (MSPNHSUS) 413.5K +18.4K (+4.45% m/m)
GDP (GDP) 30.49T +443.6B (+1.46% q/q) (5.92% annualized)
Personal Income (PI) 26.28T +95.7B (+0.36% m/m) (4.2% annualized)
Durable Goods (Orders) rose slightly, after falling for the past two months. Orders remain reasonably strong. Durable Goods Orders project economic activity in the future; this result is expansionary.
GDP also came in stronger than expected; 1.46%/q or 5.92% annualized.
Personal Income was less impressive; at 4.2% annualized, it is not keeping up with (actual) inflation.
New Home sales did well this month; the median new home sale price rose 4.66% [to $413,500], the number of homes sold (seasonally averaged) rose 20% [to 800k], but inventory (new home supply) just dropped a little bit [-1.41%].
That said, I ran the median new home sale price through an MA12 to eliminate seasonality; apparently, it’s normal to see prices rise in August. The MA12 has been slowly chopping lower since 2023. It looks like a shadow of 2007-2008.
The mortgage calculator says the median new home will cost $2,047/month, with $82,700 down. Your salary has to be at least $88k, according to that 28% salary-to-mortgage-payment rule. And that’s for 30 years. Banksters receive $323k over 30 years; “Here’s some money I printed from thin air. Pay me back or… No House For You!”
ALT: It’s GOOD to be da king!
Credit & Rates
Fed Balance Sheet (WALCL) 6.61T -202M (-0.00% w/w)
Total Bank Credit (TOTBKCR) 18.71T +2.6B (+0.01% w/w)
30 Year Mortgage Rate (MORTGAGE30US) 6.30% +4 bp
3 Month Treasury Rate (DGS3MO) 4.20% +6 bp
10 Year Treasury Rate (DGS10) 4.20% +6 bp
20+ Year Bond Fund (TLT) 88.90 -0.12 -0.04%
No QT (or QE) this week.
Total bank credit was mostly flat this week. In fact, it has moved sideways (+2.2B +0.01% m/m) for the last 4 weeks. That is really deflationary – no bankster “money printing” is happening. The economy is “booming”, but nobody is borrowing money.
Rates moved higher this week; the 10-year rose by 6 bp, but TLT just inched lower [-0.04%].

For the most part, rates moved higher, but the short end of the curve remains below the Fed Funds Rate of 4.09%. That’s a “rate
 by sand_puppy
