

This week’s disaster is all about the panic-inducing end-of-the-world (as we know it?) driven by Crazy Bibi, who seems desperate to destroy Iran (bonus: he stays out of jail), and/or the Walmart Oligarch who pretends to be against “Kings”. Given this week’s chaotic context, I have a personal story to share. “Something” caused me to buy those oil drillers (and USO) a few months back; price largely didn’t move until … here we are, with the Strait of Hormuz threatening to be closed, and/or Iran’s refineries being hit by Crazy Bibi. It is hard to rationalize the increasing number of things that have appeared to me recently.
Consumer Economy
Producer Prices (PPIACO); +0.17% m/m (2.04% annualized)
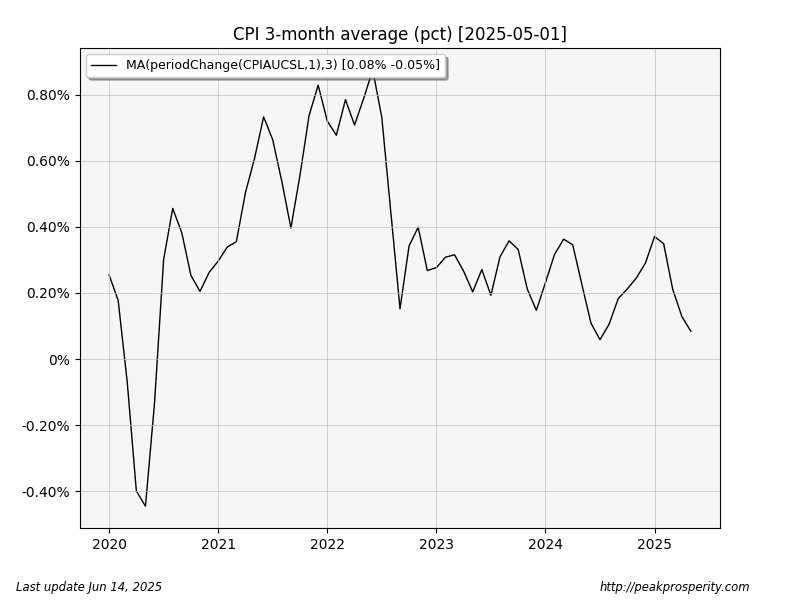
CPI All Urban (CPIAUCSL); +0.08% m/m (0.96% annualized)
Both PPI and CPI were low again this month – Biden-Autopen inflation (which mostly hit in 2021-2022 – back then, monthly inflation was 0.7%-0.8%) is far in the past. Here’s a 5-year chart of the 3-month average CPI % change. Concept: this shows the “CPI trend” which appears to be sideways-to-lower, at least for now, with “now” coming in at 0.08%.
Wolf didn’t have his usual table, so I had to dig it up from the BLS.
Table 1. Consumer Price Index for All Urban Consumers (CPI-U): U. S. city average, by expenditure category
(source – bls.gov)
Energy CPI -1.0% m/m, Food CPI +0.3% m/m, all other items CPI +0.1% m/m.
Cherry-picked sub-categories:
Hospital Services: +0.4% m/m
Vaxxident Insurance: +0.7% m/m
Sickcare Commodities: +0.6% m/m
We’re still dealing with DeathVax-flation.
Credit & Rates
Fed Balance Sheet (WALCL); 6.68T +4.3B (+0.06% w/w)
Total Bank Credit (TOTBKCR); 18.398T +5.6B (+0.03% w/w), 1.56% annualized
30 Year Mortgage Rate (MORTGAGE30US); 6.84% -1 bp
10 Year Treasury (DGS10); 4.43% -8 bp
20+ Year Bond ETF (TLT); +1.15%
No QT this week, and bank credit continues to look deflationary. Since the Trump-Tariff-Terror has passed (where a big chunk of money was borrowed to buy stuff in advance of Doom-and-Gloom), bank credit has been close to flat. That’s recessionary.
Money moved into bonds across the yield curve this week, with the largest gain in the 5-year duration.
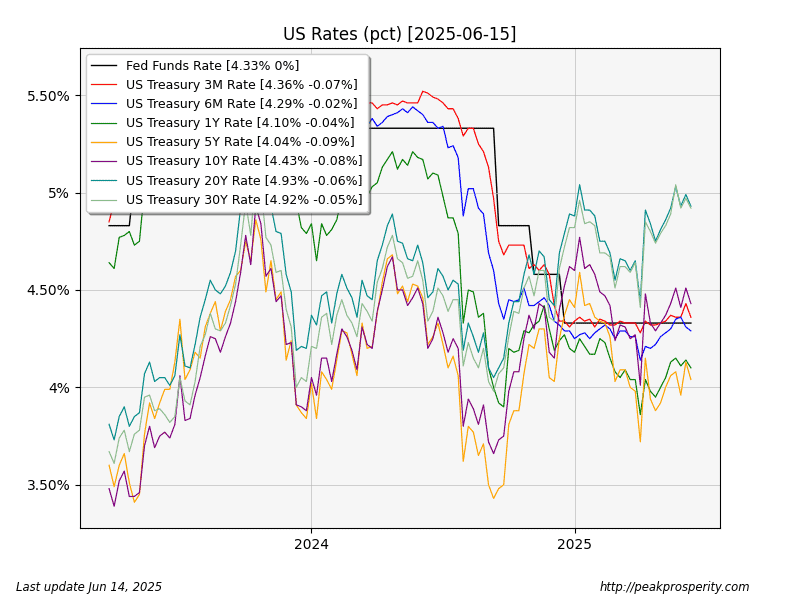
The 10-year yield fell Monday-Thursday, but then bounced back 7 points on Friday. It looks as though TLT is slowly chopping its way higher, and
 by thc0655
