

Consumer Economy
- Durable Goods, New Orders (DGORDER) 318.9B +2.7B (+0.85% m/m)
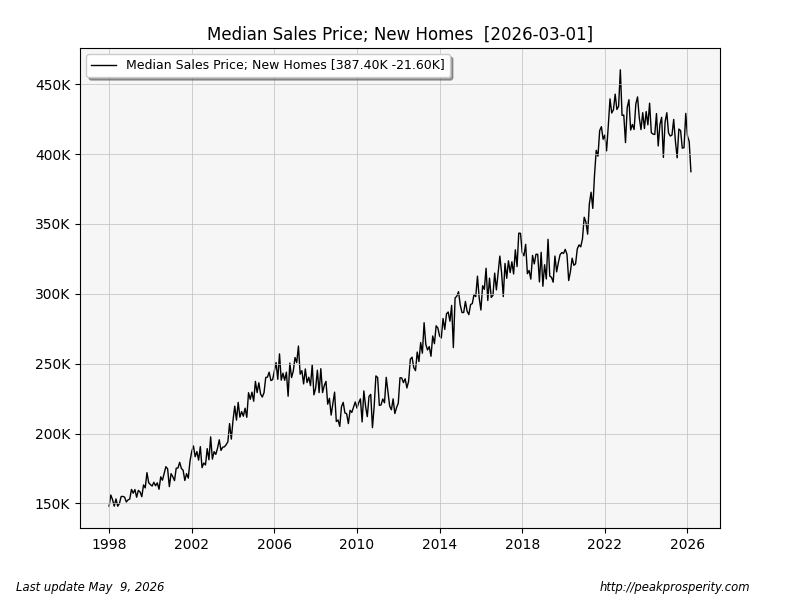
- Median New Home Sales Price (MSPNHSUS) 387.4K -21.6K (-5.28% m/m)
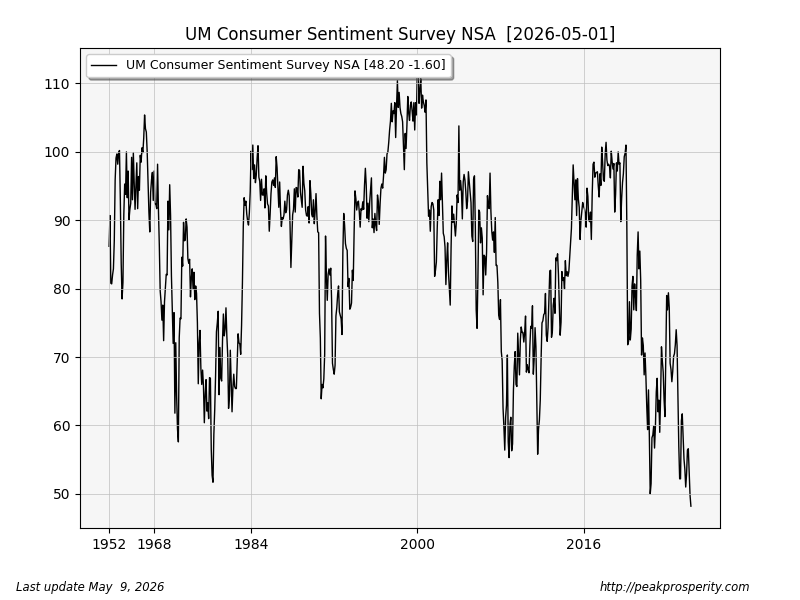
- Consumer Sentiment (UMCSENT) 48.2 -1.60 (-3.21% m/m)
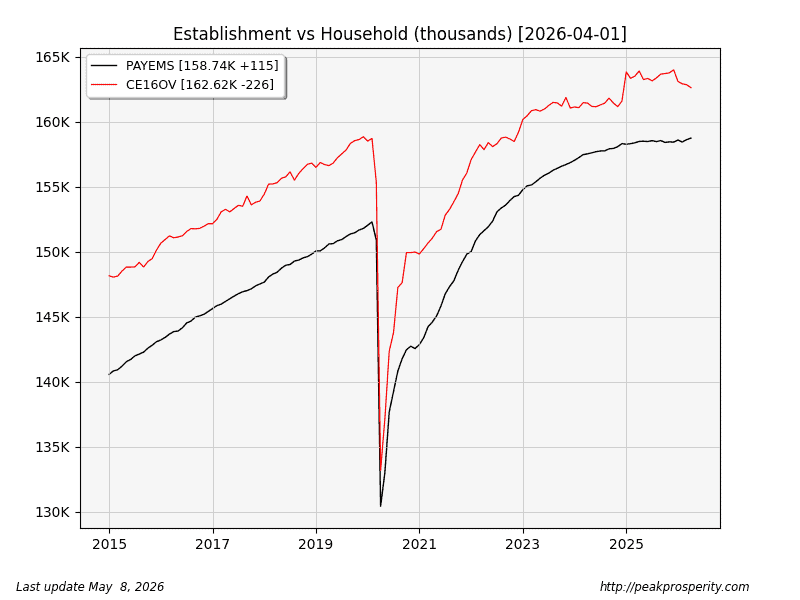
- Nonfarm Payrolls – Establishment Survey (PAYEMS) 158.7M +115K (+0.07% m/m)
- Civilian Employment – Household Survey (CE16OV) 162.6M -226K (-0.14% m/m)
No real change in durable goods orders – but not recessionary.
There was a lunge in new home sale prices to a new 5-year low. It is starting to look a little like pre-2008.
Consumer sentiment fell to another new all-time low. FRED won’t update it for a while, so I did it (again) by hand. FRED gonna FRED. This continues to be recessionary.
Nonfarm payrolls allegedly expanded this month. That said, there was an interesting difference between the “household survey” and the “establishment survey.” Headline payrolls (PAYEMS) is the “establishment” survey (they call companies to count the workers, and then make “adjustments”), while civilian employment (CE16OV) is the “household” survey (they call households to see who is working). Zero Hedge pointed this out. And more:
Closer Look Reveals April Jobs Report Was A Disaster, And AI Is Now Here To Take Your Job
(source – zerohedge)
The Zero Hedge chart comparing establishment vs household looked different than mine. The data was the same, but the Zero Hedge chart has TWO right-axis labels, which they arranged to make CE16OV look lower than PAYEMS – presumably more bearish. That’s not true. The red (CE16OV) line peaked in 2025 and is bouncing lower, while the black (PAYEMS) line (that everyone follows) inched higher.
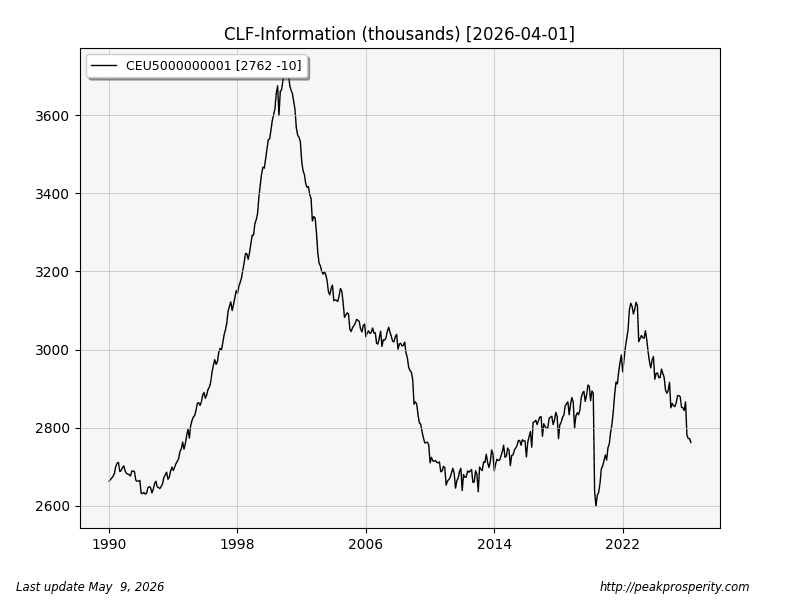
Is AI coming for your job, as ZH said? Way back when, dotcom saw a YUGE plunge in “information” jobs, and since 2022, it looks like we’re going through another iteration. Note that right now tech stocks are rallying as (around) 10% of the jobs have vanished over the last 4 years. That supports the “AI job loss claim.”
With a Disability
- CNP (LNU00074597) 36.615M +406K (+1.12%)
- CLF (LNU01074597) 8.584M -122K (-1.40%)
- EMP (LNU02074597) 7.970M -68K (-0.85%)
- NILF (LNU05074597) 28.031M +528K (+1.92%)
Total population (16+) disability rose – it was just 23k short of a new all-time high. Disabled people not in the labor force (NILF) shot up to a new all-time high,
 by mark_bc
