

Every year, Wall Street somehow manages to conjure up a Santa Claus rally. Perhaps it’s a self-fulfilling prophecy now because it has become embedded in Wall Street lore as common knowledge.
Everybody knows that everybody knows that stocks will rally…so I’d better get in on that!
But meanwhile, people struggle along in the real economy. The one in which, according to Michael Green, or Professor Plum on X, the poverty line for a family of four is $140,000.
But let’s begin with the inevitable Santa Claus rally.
December is the greenest month of them all, historically speaking. Even as terrible economic news rolls in about consumer health, shipping declines, layoffs and small business bankruptcies, the ““markets”” continue to power higher mainly based on the AI story.
But there we’ll note that the math ain’t mathing, as they say.
Finally more people are doing the math “IBM CEO says there is 'no way' spending trillions on AI data centers will pay off at today's infrastructure costs”“IBM's CEO walked through some napkin math on data centers— and said that there's "no way" to turn a profit at current… pic.twitter.com/dFwHbBMO9A
— kristen shaughnessy (@kshaughnessy2) December 2, 2025
The AI story is starting to sprout some stubborn mold, mainly along the lines of nobody being able to exactly explain where all the necessary revenues are going to come from.
On Wednesday, Dec. 3rd, Microsoft transferred some of that mold over to their block of cheese:
Futures Tumble on Report Microsoft Lowers AI Software Sales Quotas https://t.co/rpSjUtMLs4
— zerohedge (@zerohedge) December 3, 2025
But, as has been true for a long time, absolutely none of that mattered to the US equity ““markets”” on December 3rd, 2025:

Note that even the Small Caps (Russell 2000) are caught up in all this, fundamentals be darned:
Small Business Job Losses Soar In November; ADP https://t.co/AnJ9l8gpcX
— zerohedge (@zerohedge) December 3, 2025
Paul and I also discussed Silver and the idea that what we’re really witnessing isn’t higher prices for a shiny metal, but the beginning of the end for the old King Dollar regime.
In that context, these are indeed exciting times.
But the bulk of our conversation centered on the provocative position piece penned by Michael Green (ProfPlum on X), which posited that the actual poverty line for US families is now $140k for a household.
Here’s a link to the article, which I heartily encourage everyone to read.

His intro is great:
I have spent my career distrusting the obvious.
Markets, liquidity, factor models—none of these ever felt self-evident to me. Markets are mechanisms of price clearing. Mechanisms have parameters. Parameters distort outcomes. This is the lens through which I learned to see everything: find the parameter, find the distortion, find the opportunity.
But there was one number I had somehow never interrogated. One number that I simply accepted, the way a child accepts gravity.
The poverty line.
I don’t know why. It seemed apolitical, an actuarial fact calculated by serious people in government offices. A line someone else drew decades ago that we use to define who is “poor,” who is “middle class,” and who deserves help. It was infrastructure—invisible, unquestioned, foundational.
This week, while trying to understand why the American middle class feels poorer each year despite healthy GDP growth and low unemployment, I came across a sentence buried in a research paper:
“The U.S. poverty line is calculated as three times the cost of a minimum food diet in 1963, adjusted for inflation.”
I read it again. Three times the minimum food budget.
I felt sick.
The problem was that “poverty” was defined back when things were entirely different. Incomparably different in many ways.
Michael explains:
Orshansky’s food-times-three formula was crude, but as a crisis threshold—a measure of “too little”—it roughly corresponded to reality. A family spending one-third of its income on food would spend the other two-thirds on everything else, and those proportions more or less worked. Below that line, you were in genuine crisis. Above it, you had a fighting chance.
But everything changed between 1963 and 2024.
Housing costs exploded. Healthcare became the largest household expense for many families. Employer coverage shrank while deductibles grew. Childcare became a market, and that market became ruinously expensive. College went from affordable to crippling. Transportation costs rose as cities sprawled and public transit withered under government neglect.
The labor model shifted. A second income became mandatory to maintain the standard of living that one income formerly provided. But a second income meant childcare became mandatory, which meant two cars became mandatory. Or maybe you’d simply be “asking for a lot generationally speaking” because living near your parents helps to defray those childcare costs.
The composition of household spending transformed completely. In 2024, food-at-home is no longer 33% of household spending. For most families, it’s 5 to 7 percent.
Housing now consumes 35 to 45 percent. Healthcare takes 15 to 25 percent. Childcare, for families with young children, can eat 20 to 40 percent.
The problem is that the way the system is configured, a family might well find themselves doing worse and worse as they earn more and more as they try to claw their way out of crushing poverty.
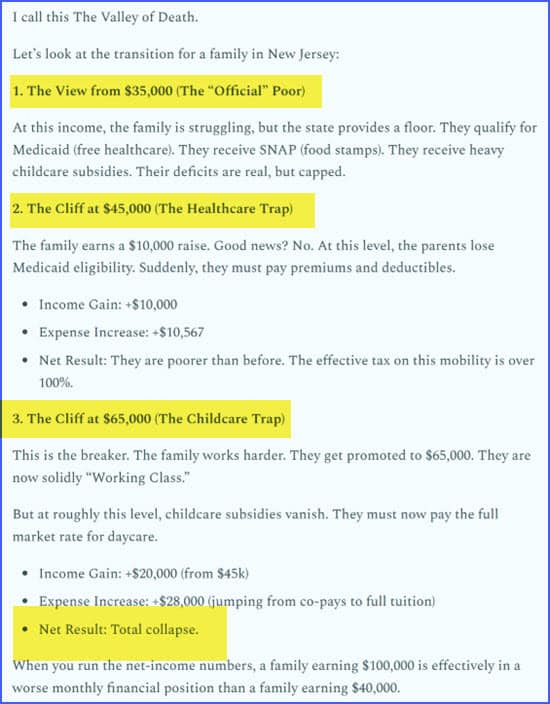
This is a well-known feature of public policy. Here’s how the city of Fayetteville, Arkansas, calculates the CLIFF based on hourly income:

(Source)
As a family moves from $10/hr to $26/hr, they do better and better, but still don’t achieve positive Net Financial Resources (NFR). That’s the “paycheck to paycheck” situation we talk about so frequently.
But then, between $26 and $27/hr, disaster strikes! Benefits are withdrawn such that a family earning $27/hr is not only far worse off than a family pulling in $27/hr, but they fall to the very worst point on the entire chart.
From there, they have to climb to $40/hr to claw their way up to zero on the NFR chart.
By the way, at 2,000 working hours, that’s an annual income of $80,000.
So, is the correct poverty line $140k or is it $80k…if we define poverty as lacking sufficient resources to provide any buffer for your family (aka ‘savings’).
I don’t know, but it’s well past time that we had the conversation.
Kiker Wealth Management – Our Endorsed Financial Advisors
Many investors today are looking for a more intentional, risk-managed approach rather than a passive “set-it-and-forget-it” strategy. If you’d like to explore how a disciplined process may help strengthen your plan, you can schedule a free, no-obligation meeting with Paul Kiker and the team at Kiker Wealth Management to review your portfolio and strategy.
Clients frequently share that Paul’s guidance brings clarity and direction to their financial decision-making.
To schedule your initial meeting, please visit PeakFinancialInvesting.com, complete the simple form, and a member of Paul’s team will contact you within 48 business hours to arrange the first call.
“This is an endorsement. The individual providing these statements is not a client of Kiker Wealth Management but is a compensated promoter under a written agreement. Because they received compensation, they have a material conflict of interest in recommending Kiker Wealth Managements services. “
FINANCIAL DISCLAIMER. PEAK PROSPERITY, LLC, AND PEAK FINANCIAL INVESTING ARE NOT ENGAGED IN RENDERING LEGAL, TAX, OR FINANCIAL ADVICE OR SERVICES VIA THIS WEBSITE. NEITHER PEAK PROSPERITY, LLC NOR PEAK FINANCIAL INVESTING ARE FINANCIAL PLANNERS, BROKERS, OR TAX ADVISORS. Their websites are intended only to assist you in your financial education. Your personal financial situation is unique, and any information and advice obtained through this website may not be appropriate for your situation. Accordingly, before making any final decisions or implementing any financial strategy, you should consider obtaining additional information and advice from your accountant or other financial advisers who are fully aware of your individual circumstances.


 by davefairtex