

Significant global economic damage has already happened across the world as a consequence of the war of choice waged on Iran by the US and Israel.
Even if the conflict ends this very moment, it will be many months, if not a year or longer, before normality returns to the flows of critical energy molecules and materials from the Persian Gulf.
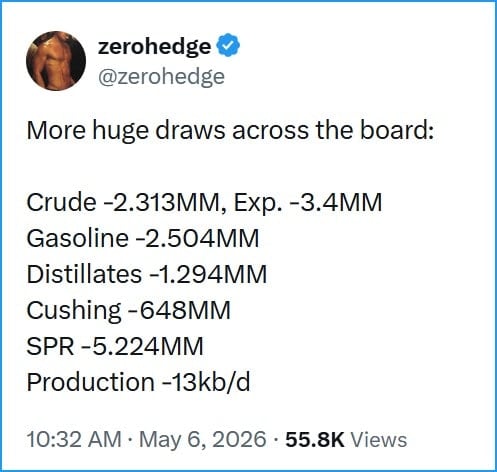
To try and keep a lid on it all for as long as possible, the US is steadily, if not rapidly, draining its reserves of hydrocarbons and selling them to the world at market-suppressed prices.
Naturally, keeping prices down only serves to keep demand higher than it would be (if prices were higher).
If anybody in the US wants to know why their gasoline prices are rising, this chart explains it all:
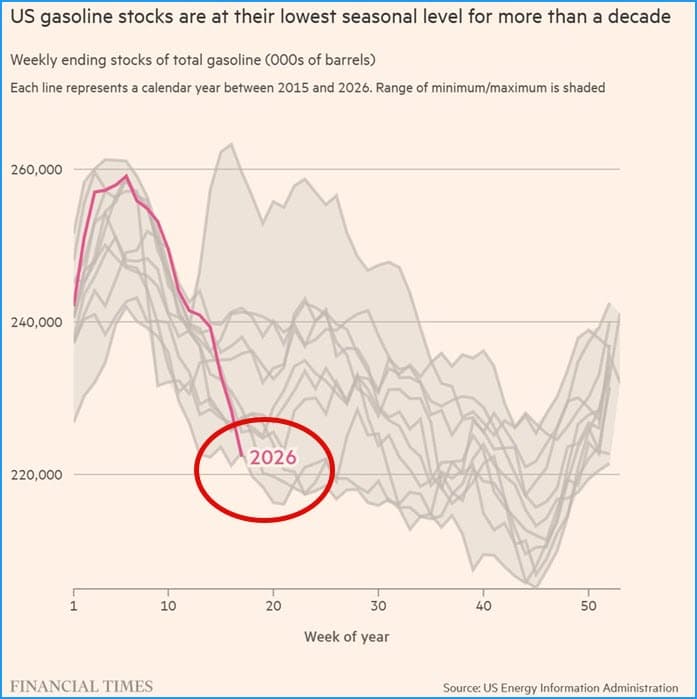
And that’s with the summer driving season still before us.
But it’s more than just oil and gasoline. LNG is also missing from the world stage, which represents work that was not done and that means economic activity that did not happen.
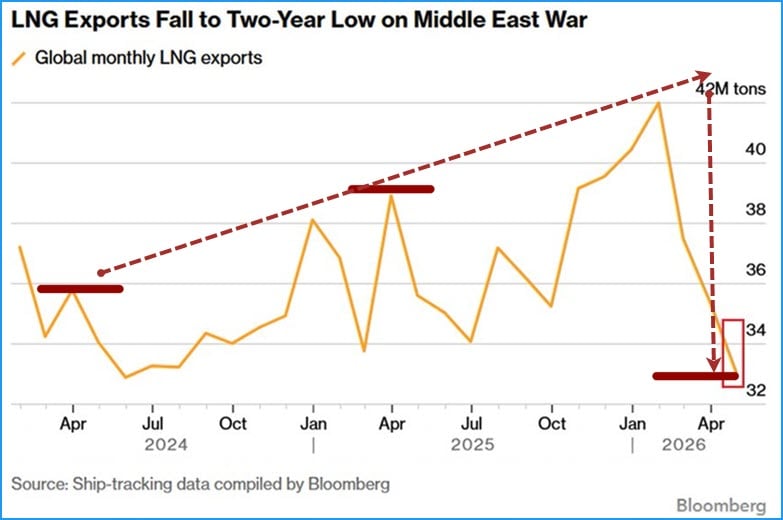
That’s ~ 10 million tons that’s gone missing…and that’s huge.
So how then can we square up this economic damage with such charts as this one from the South Korean Kospi stock exchange?
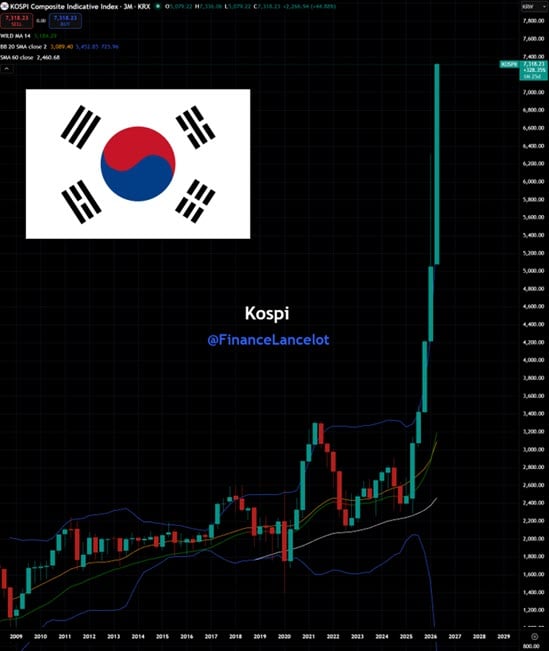
I’d like my subscribers to consider three possible explanations.
1 – Pure Bubble: Classic blow-off top behavior across multiple markets. I assign this a 20% probability of being ‘the reason.’
2 – An Engineered Failure Setup: Markets are being pumped


 by chipshot